Fig. 5.
Download original image
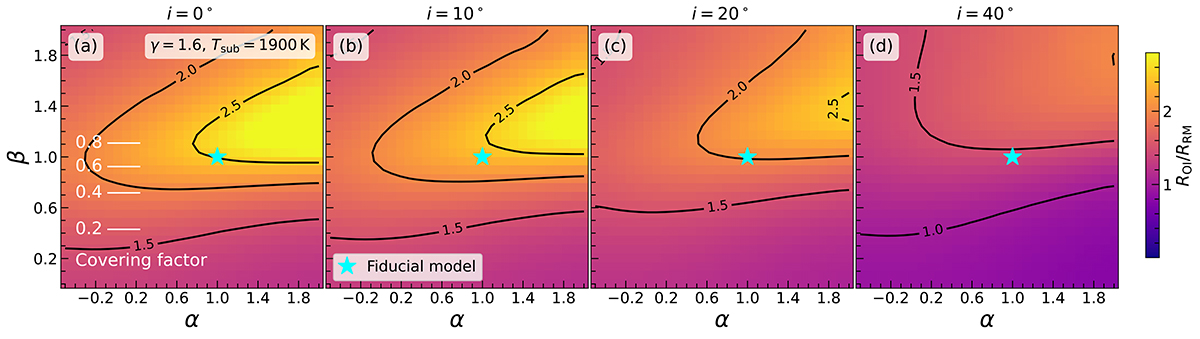
Exploration of the parameter space of the hot dust structure model. The colour maps show the derived ROI/RRM ratio based on different α and β in grids. The four columns present the model with different inclination angles (i from 0° to 40°). The geometric covering factor of the model is labelled on the left. A fiducial model, which can qualitatively explain our observed ROI/RRM ≈ 2, is indicated by the cyan star.
Current usage metrics show cumulative count of Article Views (full-text article views including HTML views, PDF and ePub downloads, according to the available data) and Abstracts Views on Vision4Press platform.
Data correspond to usage on the plateform after 2015. The current usage metrics is available 48-96 hours after online publication and is updated daily on week days.
Initial download of the metrics may take a while.