Fig. 4.
Download original image
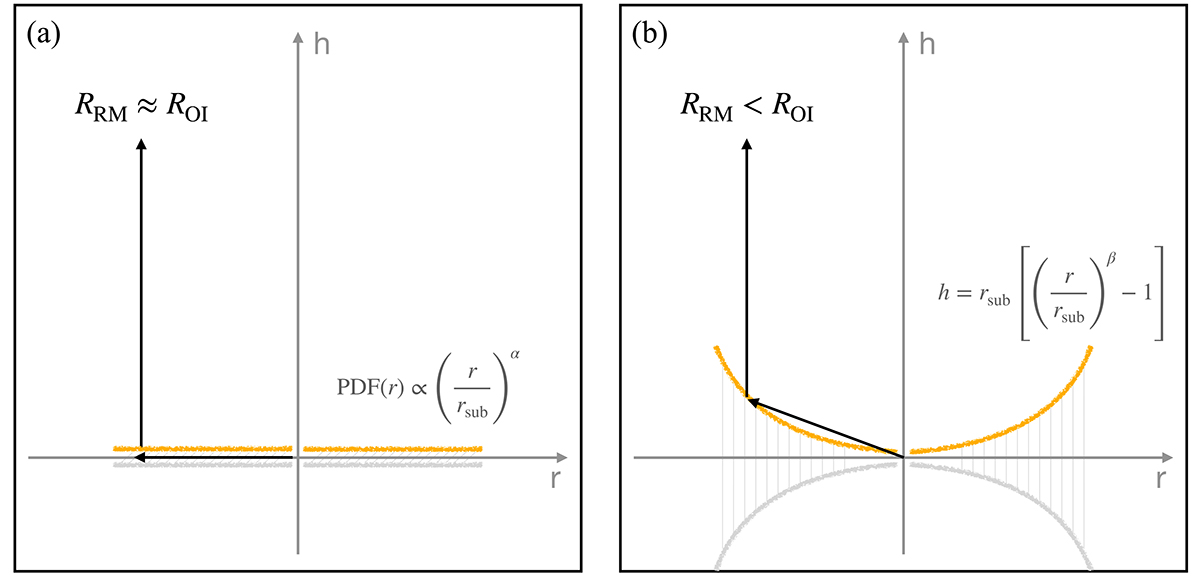
Sketch of the hot dust structure model. The hot dust emission is in yellow. The cloud radial distribution follows a power law with the index α, and the cloud height above the midplane is close to a power-law function controlled by β. Panel a shows the model with β ≈ 0, while panel b shows a model with β > 0. We show the models in an edge-on view with the observer to the positive direction of h to illustrate the ‘foreshortening effect’. In this way model (a) has RRM ≈ ROI, while model (b) has RRM < ROI.
Current usage metrics show cumulative count of Article Views (full-text article views including HTML views, PDF and ePub downloads, according to the available data) and Abstracts Views on Vision4Press platform.
Data correspond to usage on the plateform after 2015. The current usage metrics is available 48-96 hours after online publication and is updated daily on week days.
Initial download of the metrics may take a while.