Fig. 2.
Download original image
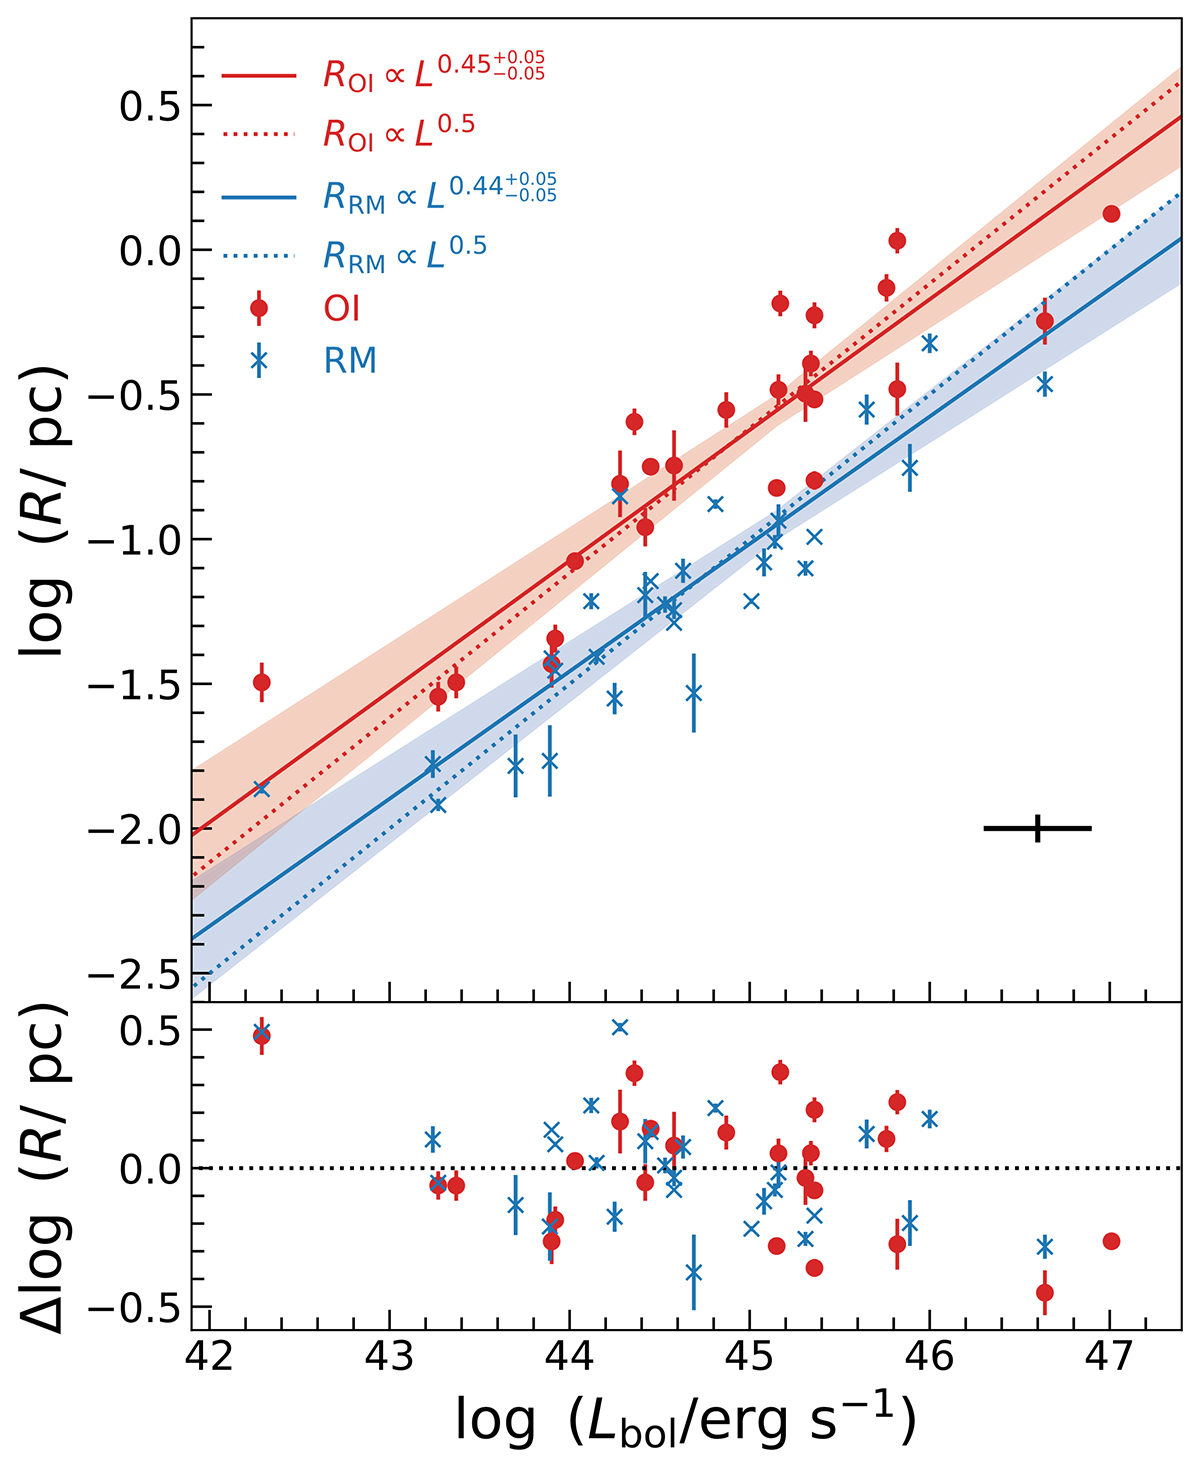
Dust radius as a function of bolometric luminosity (R − Lbol relation). OI measured sizes are shown in red and RM measured sizes are shown in blue. The typical 0.3 dex uncertainty in Lbol is indicated in the right corner. The solid lines show our best-fit results, with the shaded regions showing the 1σ uncertainties of the fittings, while the dotted lines represent the fitting results with the slopes m fixed to 0.5. Our best-fitting R − Lbol relations are consistent with the slope of 0.5 within 1σ. The bottom panel shows the dust radius residuals from the fitted relation with fixed slopes of 0.5.
Current usage metrics show cumulative count of Article Views (full-text article views including HTML views, PDF and ePub downloads, according to the available data) and Abstracts Views on Vision4Press platform.
Data correspond to usage on the plateform after 2015. The current usage metrics is available 48-96 hours after online publication and is updated daily on week days.
Initial download of the metrics may take a while.