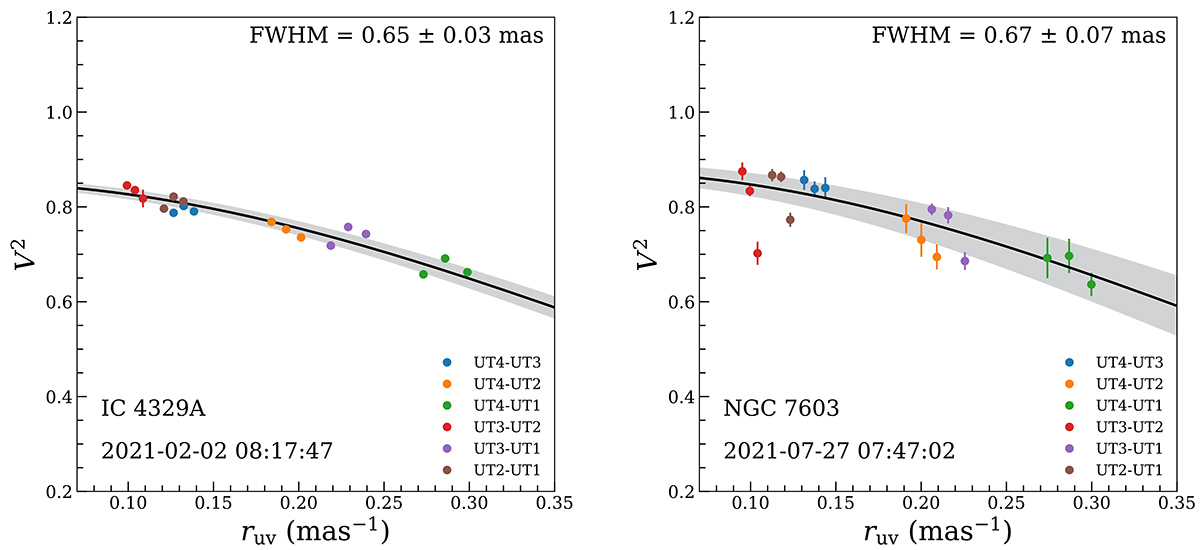
Fig. 1.
Download original image
FWHM visibility fitting for two single exposures. The coloured dots with error bars show the visibilities measured at different baselines. The best-fitting results from Eq. (1) are shown as black solid lines; the grey shaded regions show the 1σ fitting uncertainties. The dates and the UTC time are shown in the bottom left corners of each panel. The left panel illustrates a typical exposure, while the right panel shows an example of poor-quality data.
Current usage metrics show cumulative count of Article Views (full-text article views including HTML views, PDF and ePub downloads, according to the available data) and Abstracts Views on Vision4Press platform.
Data correspond to usage on the plateform after 2015. The current usage metrics is available 48-96 hours after online publication and is updated daily on week days.
Initial download of the metrics may take a while.