Fig. 4.
Download original image
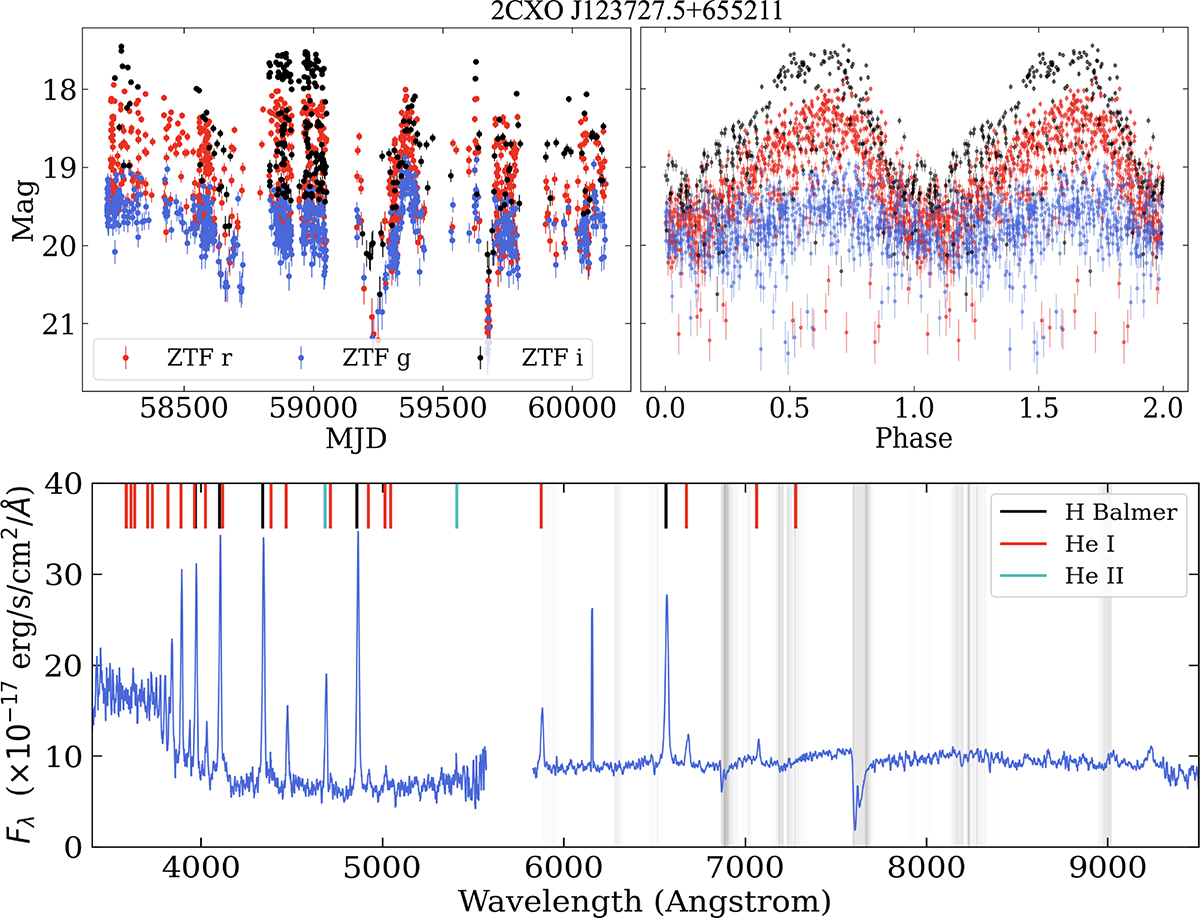
ZTF long-term (top left) and phase-folded (top right) light curves in g, r, and i filters and the DBSP optical spectrum of 2CXO J123727.5+655211 (bottom). The gray lines represent the Keck Telluric Line List. The optical spectrum shows hydrogen, helium, and high-excitation He II 4686 Å emission lines, giving a line ratio of He II/Hβ ≈ 0.37 (see Table 3). Together with optical light curves, this indicates that the object is a polar (see Sect. 5.1.3 for more details).
Current usage metrics show cumulative count of Article Views (full-text article views including HTML views, PDF and ePub downloads, according to the available data) and Abstracts Views on Vision4Press platform.
Data correspond to usage on the plateform after 2015. The current usage metrics is available 48-96 hours after online publication and is updated daily on week days.
Initial download of the metrics may take a while.