Fig. 3.
Download original image
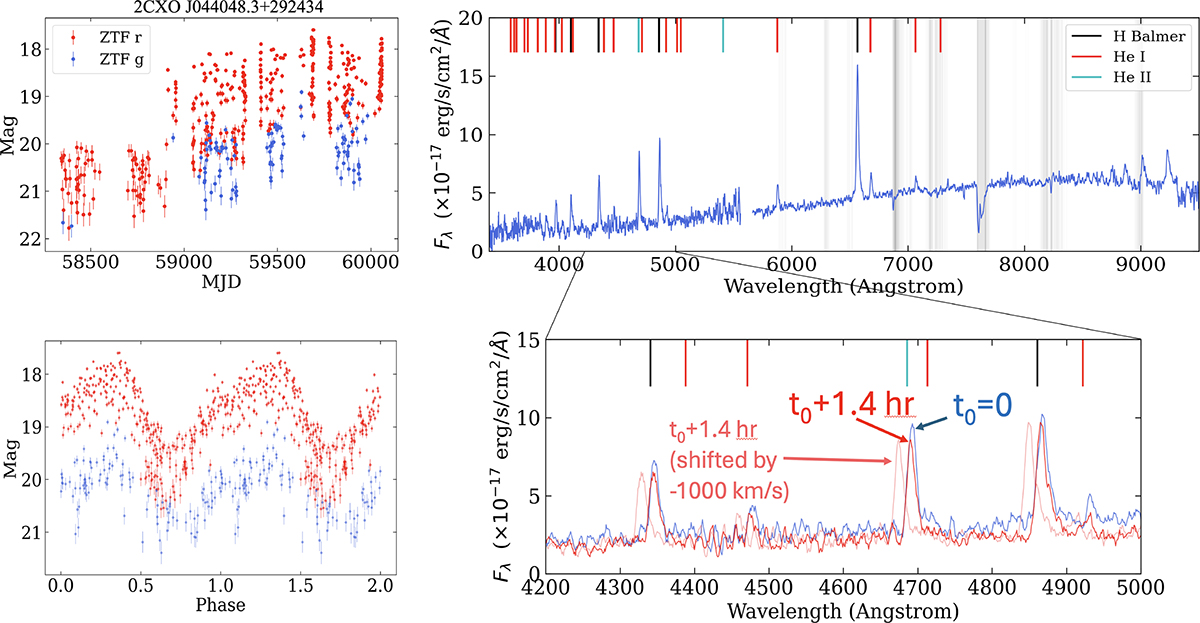
ZTF long-term (top left) and phase-folded (bottom left) light curves in g and r filters and the DBSP optical spectrum of 2CXO J044048.3+292434 (right). The gray lines represent the Keck Telluric Line List. The optical spectrum (top right) shows the hydrogen Balmer and helium emission lines and high-excitation He II 4686 Å emission line, giving a high line ratio He II/Hβ ≈ 0.64 (see Table 3). Optical and X-ray properties indicate that the object is a polar. Bottom right panel: Since two spectra taken 1.4 h apart do not show a significant radial velocity shift (a ≈ 1000 km/s shift would be expected if this were half of the orbital period and the system were viewed edge-on), the 1.3 h period is preferable. However, time-resolved spectroscopy for 2.6 h would be the only way to confirm the orbital period of this system, leading us to currently label the orbital period as either 1.3 or 2.6 h (see Sect. 5.1.1 for more details).
Current usage metrics show cumulative count of Article Views (full-text article views including HTML views, PDF and ePub downloads, according to the available data) and Abstracts Views on Vision4Press platform.
Data correspond to usage on the plateform after 2015. The current usage metrics is available 48-96 hours after online publication and is updated daily on week days.
Initial download of the metrics may take a while.