Fig. 9
Download original image
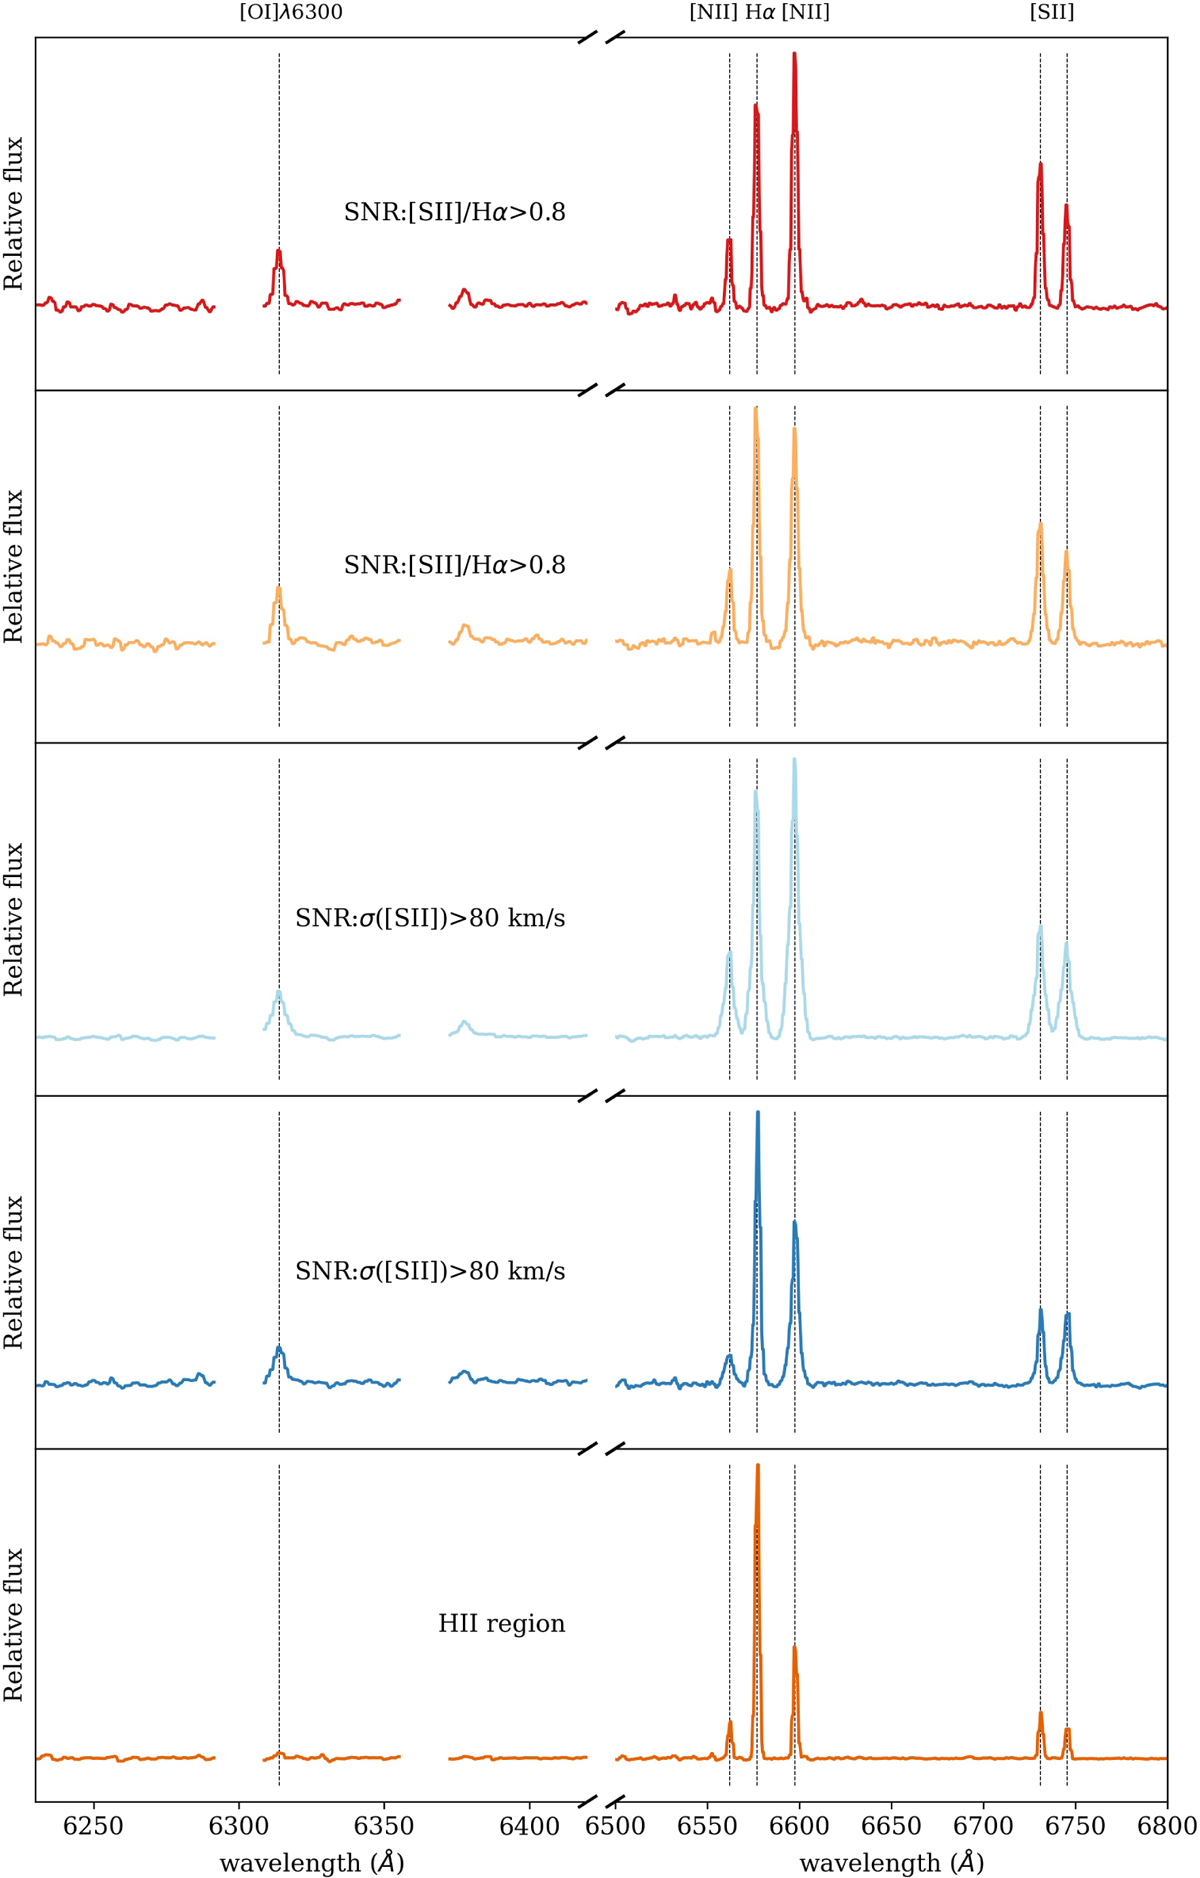
Spectra for four SNRs and an H II region in NGC 628. Top two: SNRs with high [S II]/Hα value > 0.8; middle two: SNRs with high-velocity dispersion > 80 km s−1; bottom one: H II region. Characteristic lines, e.g., [O I], [S II], [N II], and Hα are labeled in the plot. All SNRs have broader emission lines than the H II region, though this is most apparent in the two SNRs (NGC0628_17 and NGC0628_48) as they were selected to have particularly broad lines. The sky emission at [O I]λ6300Å, λ6363Å has been masked.
Current usage metrics show cumulative count of Article Views (full-text article views including HTML views, PDF and ePub downloads, according to the available data) and Abstracts Views on Vision4Press platform.
Data correspond to usage on the plateform after 2015. The current usage metrics is available 48-96 hours after online publication and is updated daily on week days.
Initial download of the metrics may take a while.