Fig. 5
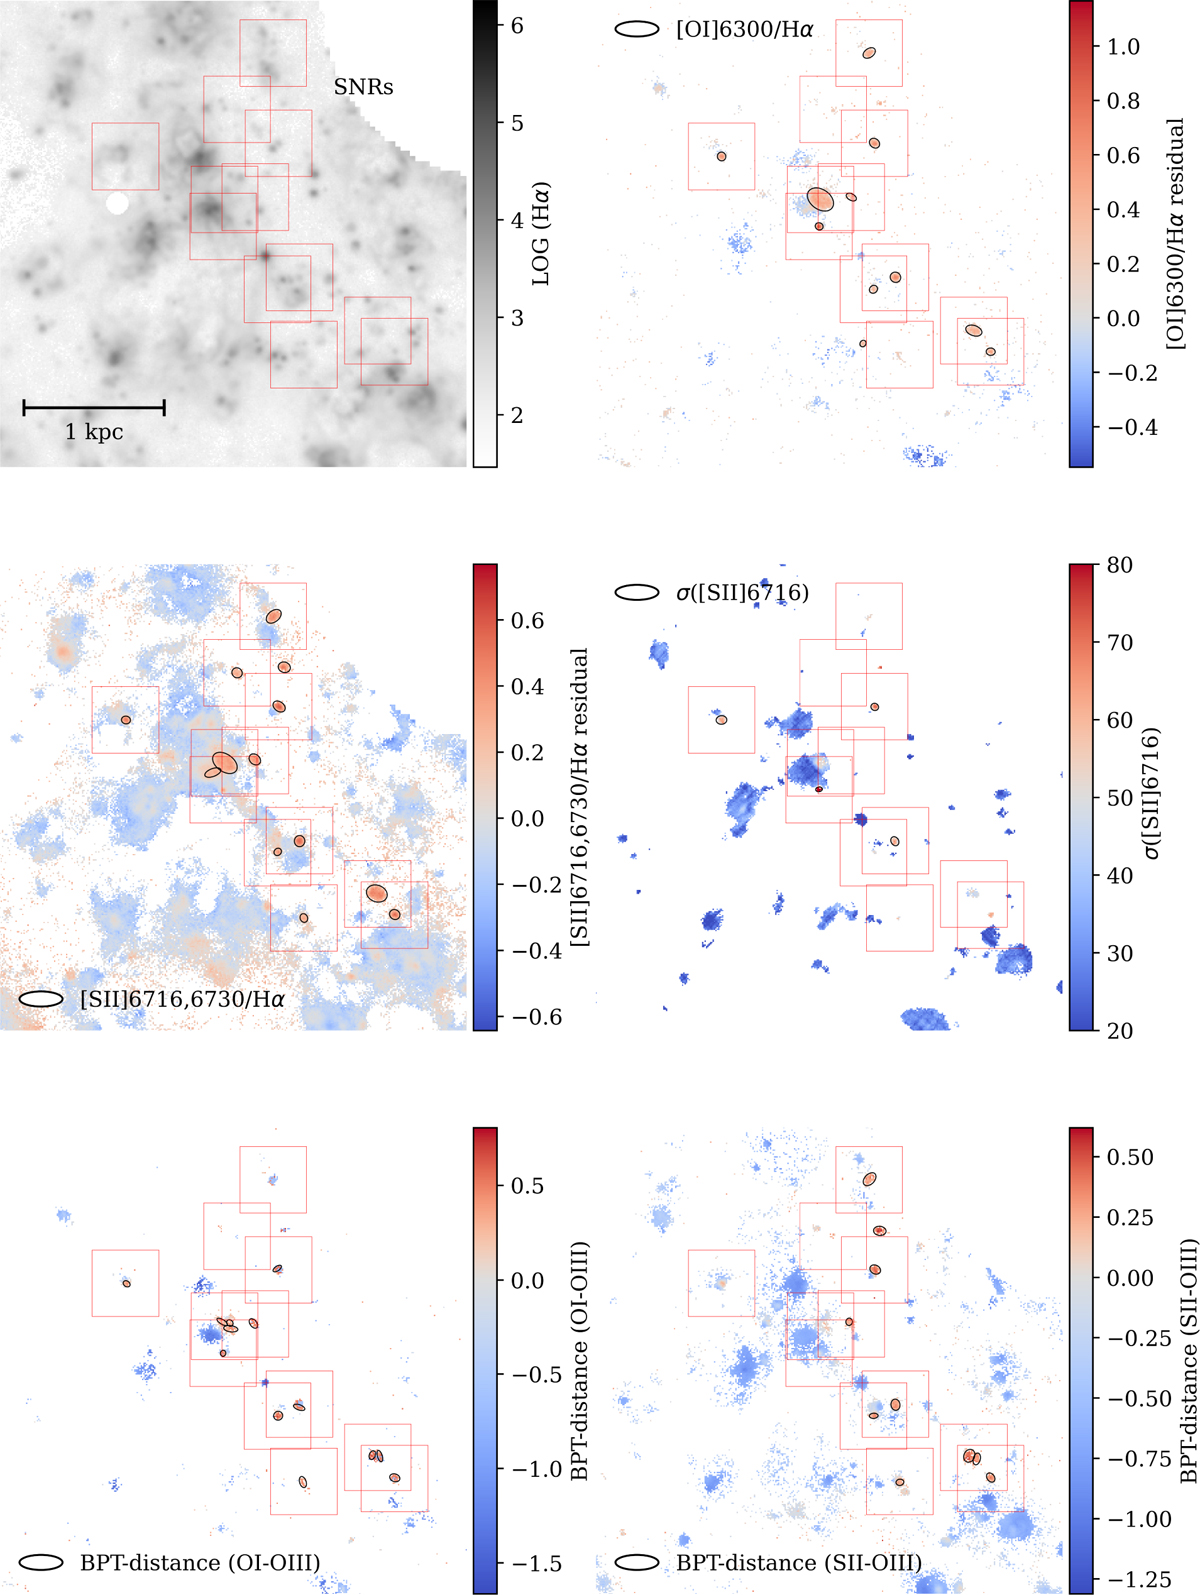
Download original image
Zoomed-in map (3 kpc × 3 kpc) of the SNR population recovered in one of the galaxies in our sample, NGC 628, using our five selection criteria (described in Sec. 3). Panels from top left to bottom right show the log Hα emission, [O I]/Hα residual map, [S II]/Hα residual map, [S II]λ6716 velocity dispersion, BPT distance (OI-OIII) map, and the BPT distance (SII-OIII) map. Objects selected by each individual criterion are marked with black ellipses in the corresponding subplot and the locations of objects classified as SNR are marked with red boxes. Pixels with low S/N (≤5), and those corresponding to stellar sources, and the central region of the galaxy, have been masked (see text for details).
Current usage metrics show cumulative count of Article Views (full-text article views including HTML views, PDF and ePub downloads, according to the available data) and Abstracts Views on Vision4Press platform.
Data correspond to usage on the plateform after 2015. The current usage metrics is available 48-96 hours after online publication and is updated daily on week days.
Initial download of the metrics may take a while.