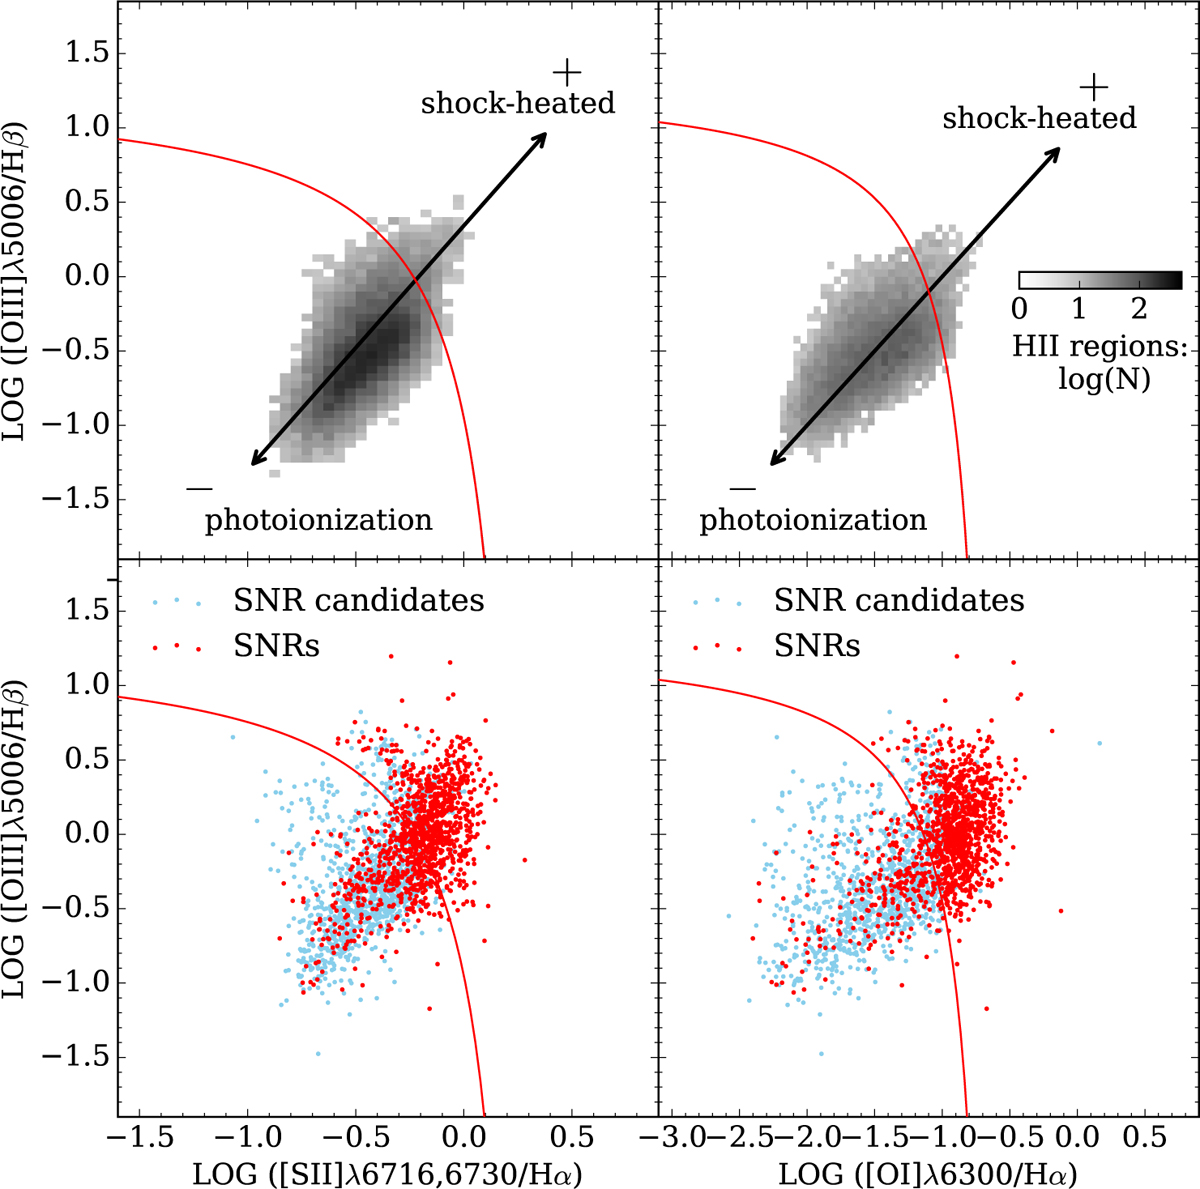
Fig. 4
Download original image
BPT diagrams with demarcation line from Kewley et al. (2006) with an indication of BPT distances as defined as the distance to the red solid extreme star-burst lines. The plus sign (+) indicates positive distance where shock-heating dominates, while the minus sign (-) indicates negative distance where photoionization dominates. The top left and top right plots show the distribution density of nebular regions in these 19 galaxies (Groves et al. 2023). In the bottom left and bottom right plots, SNRs and SNR candidates are indicated by red and blue dots, respectively. Nebular regions tend to occupy the photoionized region, while SNRs are concentrated in the shocked areas.
Current usage metrics show cumulative count of Article Views (full-text article views including HTML views, PDF and ePub downloads, according to the available data) and Abstracts Views on Vision4Press platform.
Data correspond to usage on the plateform after 2015. The current usage metrics is available 48-96 hours after online publication and is updated daily on week days.
Initial download of the metrics may take a while.