Fig. 3
Download original image
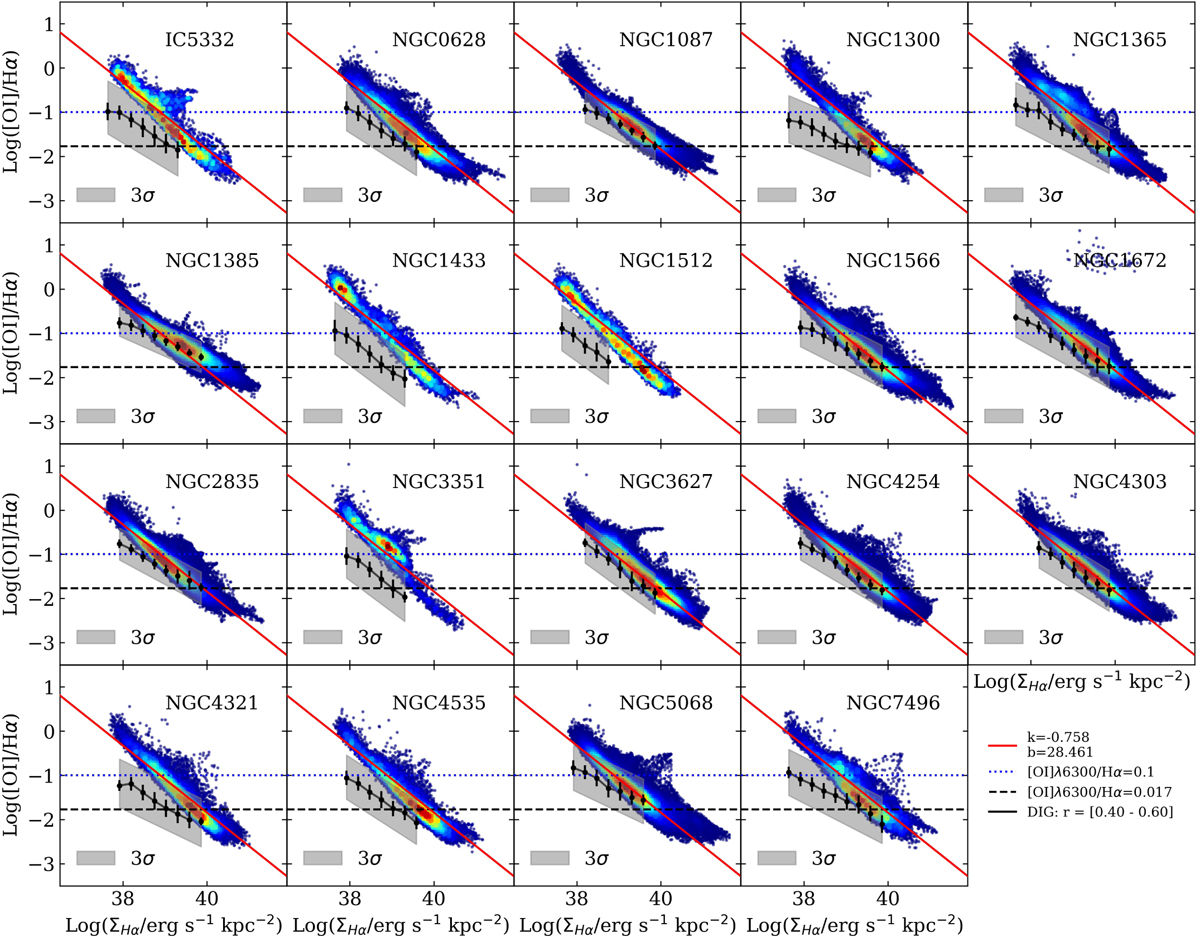
log([O I]/Hα) as a function of log Hα surface brightness for all pixels in all 19 galaxies. The red solid line is the fitted global correlation for all galaxies, with slope and intercept provided in the lower right corner of this plot. The black solid line is representative of the DIG relation, as measured between 0.40 Rmax (maximum radial coverage) and 0.60 Rmax for each galaxy from Belfiore et al. (2022). The gray area indicates the 3σ range of this relation. The black dashed line indicates the theoretical value of [O I]/Hα = 0.017 to select SNRs (Kopsacheili et al. 2020). The horizontal blue dotted line indicates the empirical value of [O I]/Hα = 0.1 used select SNRs. For NGC 1672, the individual pixels lying above the majority come from an SNe that just happened several days before our observation.
Current usage metrics show cumulative count of Article Views (full-text article views including HTML views, PDF and ePub downloads, according to the available data) and Abstracts Views on Vision4Press platform.
Data correspond to usage on the plateform after 2015. The current usage metrics is available 48-96 hours after online publication and is updated daily on week days.
Initial download of the metrics may take a while.