Fig. 2
Download original image
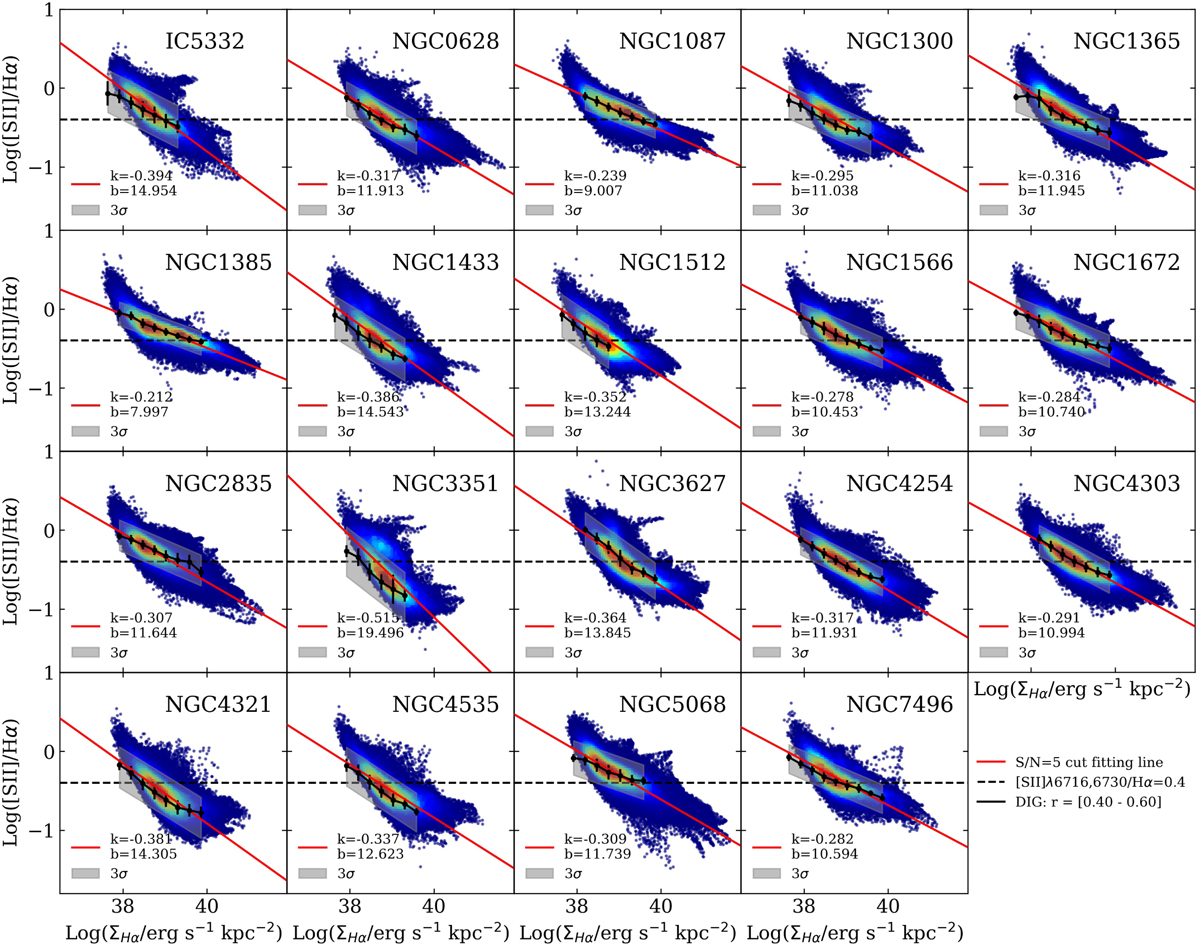
Log([S II]/Hα) as a function of logarithm Hα surface brightness for all pixels in each galaxy. The red solid line is the fitted correlation for each galaxy, with slope and intercept values given in the legend of each panel. The black solid line is representative of the DIG relation, as measured between 0.40 Rmax (maximum radial coverage) and 0.60 Rmax for each galaxy from Belfiore et al. (2022). The gray area indicates the 3σ range of this relation. SNRs typically lie above the fitted lines and show a looping structure toward the upper right. The horizontal black dashed line indicates the typical value of [S II]/Hα = 0.4 used to select SNRs. Many low Hα surface brightness pixels associated with the DIG have [S II]/Hα ≥ 0.4.
Current usage metrics show cumulative count of Article Views (full-text article views including HTML views, PDF and ePub downloads, according to the available data) and Abstracts Views on Vision4Press platform.
Data correspond to usage on the plateform after 2015. The current usage metrics is available 48-96 hours after online publication and is updated daily on week days.
Initial download of the metrics may take a while.