Fig. 19
Download original image
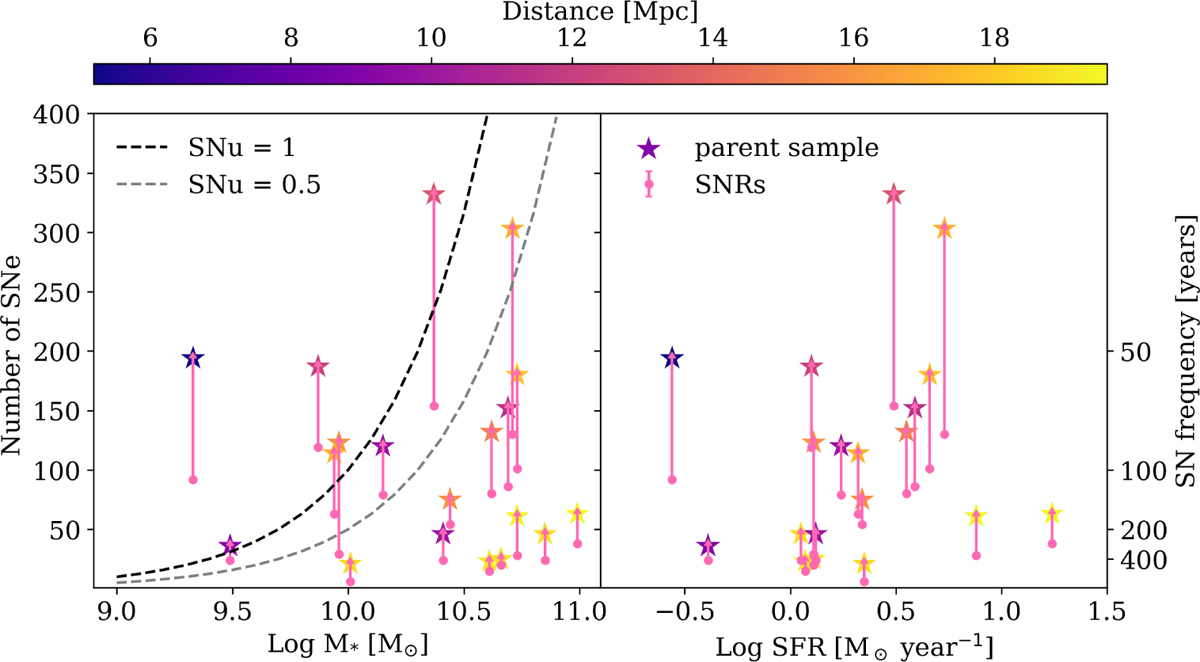
Number of SNe as a function of stellar mass (left) and SFR (right) considering the entire parent sample, colored by galaxy distance and considering galaxy integrated properties measured only within the MUSE field of view. These SN counts can also directly be converted to a SN frequency by assuming SNRs are visible in the optical for 10 000 yr. Lines of constant SN rate per unit mass (SNu) are also shown. The star markers represent the number for the parent sample while the circles are the number of SNRs. The line between them shows the range of possible true SNR numbers.
Current usage metrics show cumulative count of Article Views (full-text article views including HTML views, PDF and ePub downloads, according to the available data) and Abstracts Views on Vision4Press platform.
Data correspond to usage on the plateform after 2015. The current usage metrics is available 48-96 hours after online publication and is updated daily on week days.
Initial download of the metrics may take a while.