Fig. 15
Download original image
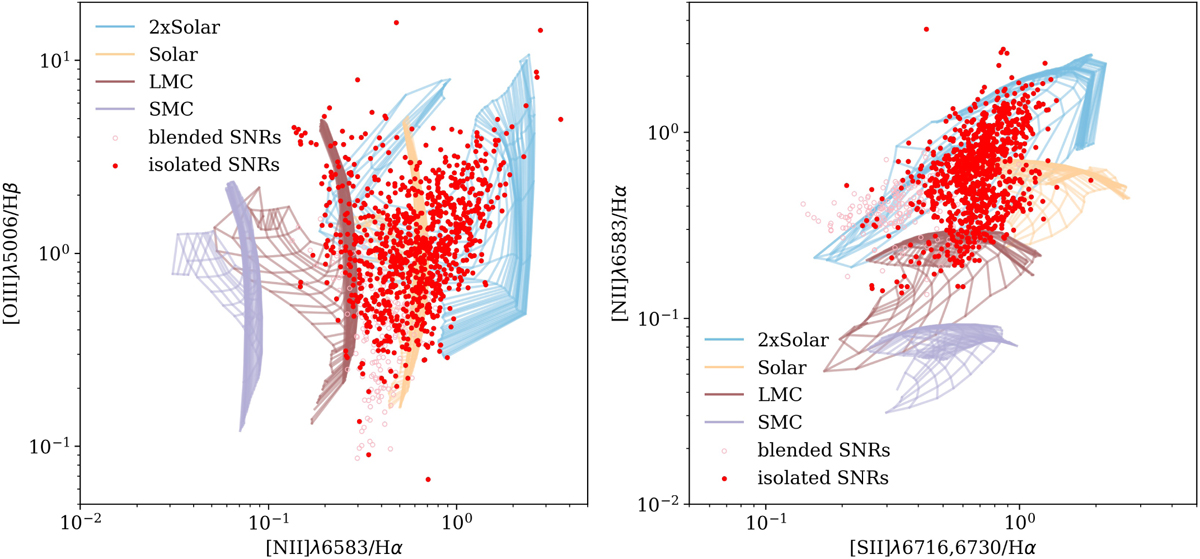
Comparison of supernova remnant properties with MAPPINGS models. Left: Observed [O III]λ5006/Hβ versus [N II]λ6583/Hα for SNRs (red dots). Right: Observed [N II]λ6583/Hα versus [S II]/Hα for SNRs (red dots). For SNRs that overlap with a H II region, the symbol is an empty light red circle. Background grids are MAPPINGS models with different metallicities. Our identified SNRs mostly lie between models for LMC and twice solar metallicities.
Current usage metrics show cumulative count of Article Views (full-text article views including HTML views, PDF and ePub downloads, according to the available data) and Abstracts Views on Vision4Press platform.
Data correspond to usage on the plateform after 2015. The current usage metrics is available 48-96 hours after online publication and is updated daily on week days.
Initial download of the metrics may take a while.