Fig. 14
Download original image
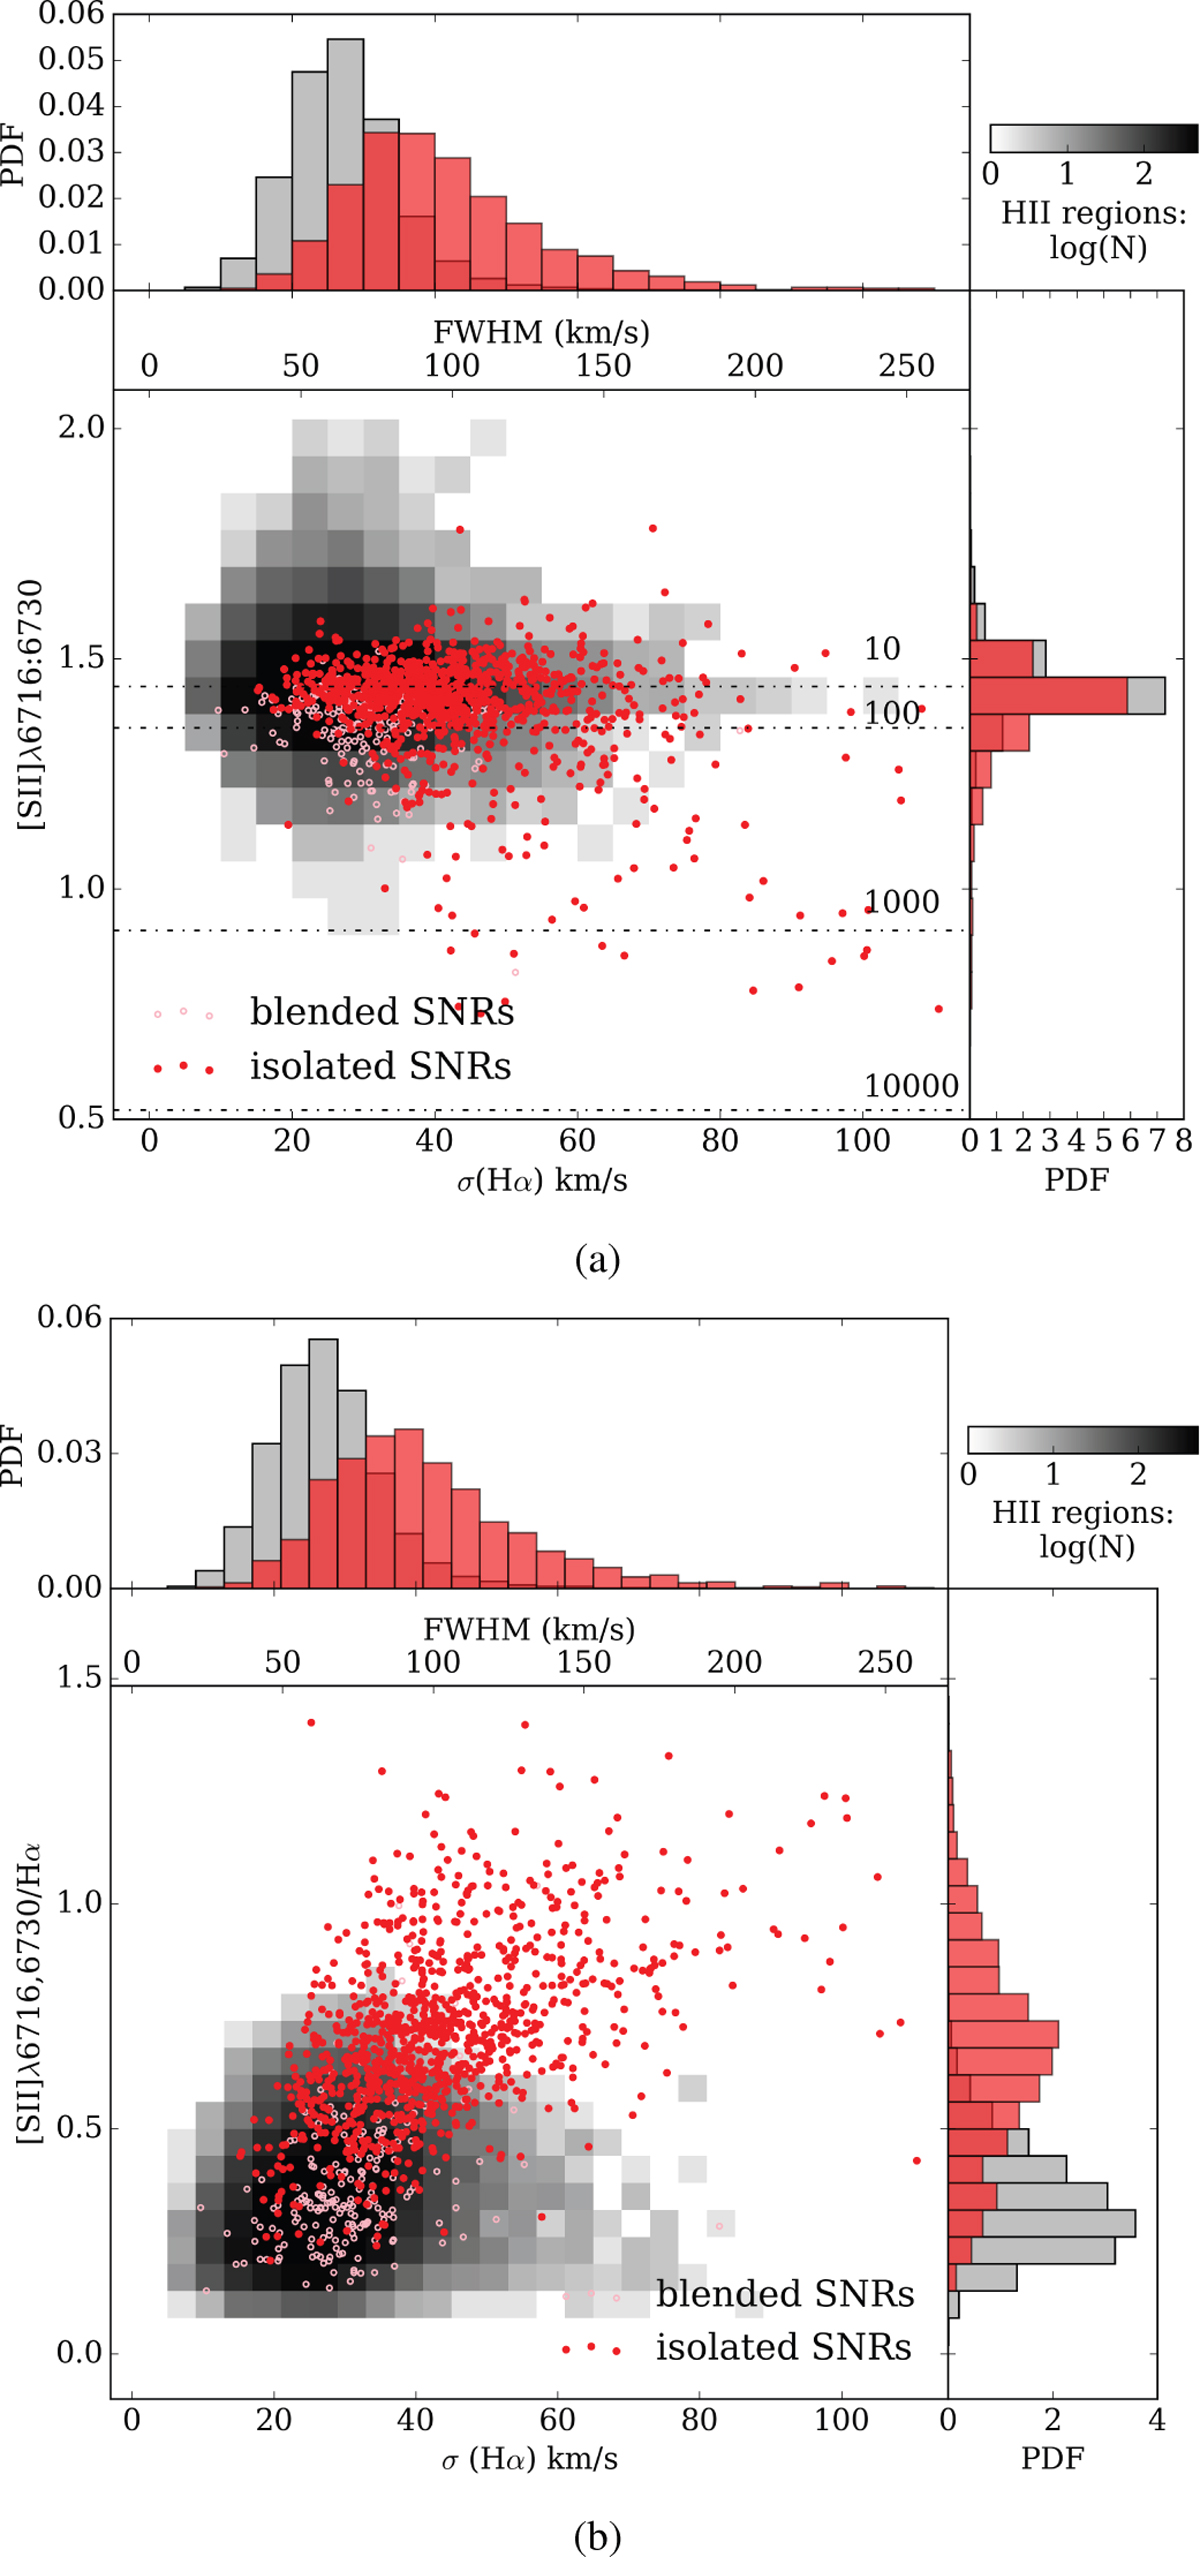
Comparison of emission-line ratios and velocity dispersion for supernova remnants (SNRs) and H II regions. Panel (a): Line ratios of [S II] versus velocity dispersion of SNRs and H II regions. The top axis shows the FWHM. The Hα velocity dispersion changes with the [S II]λ6716/[S II]λ6730 ratio for SNRs (red dots) and H II regions (in grayscale). The ratios above 1.4 are not physical and are due to noise. The horizontal dash-dotted lines indicate different electron densities with the corresponding value next to it. Panel (b): Velocity dispersion of Hα changes with [S II]λ6716,6730/Hα ratio for SNRs (red dots) and H II regions (in grayscale). For SNRs that overlap with a H II region, the symbol is an empty circle in light red. These two criteria work effectively together in distinguishing between SNRs and H II regions.
Current usage metrics show cumulative count of Article Views (full-text article views including HTML views, PDF and ePub downloads, according to the available data) and Abstracts Views on Vision4Press platform.
Data correspond to usage on the plateform after 2015. The current usage metrics is available 48-96 hours after online publication and is updated daily on week days.
Initial download of the metrics may take a while.