Fig. 1
Download original image
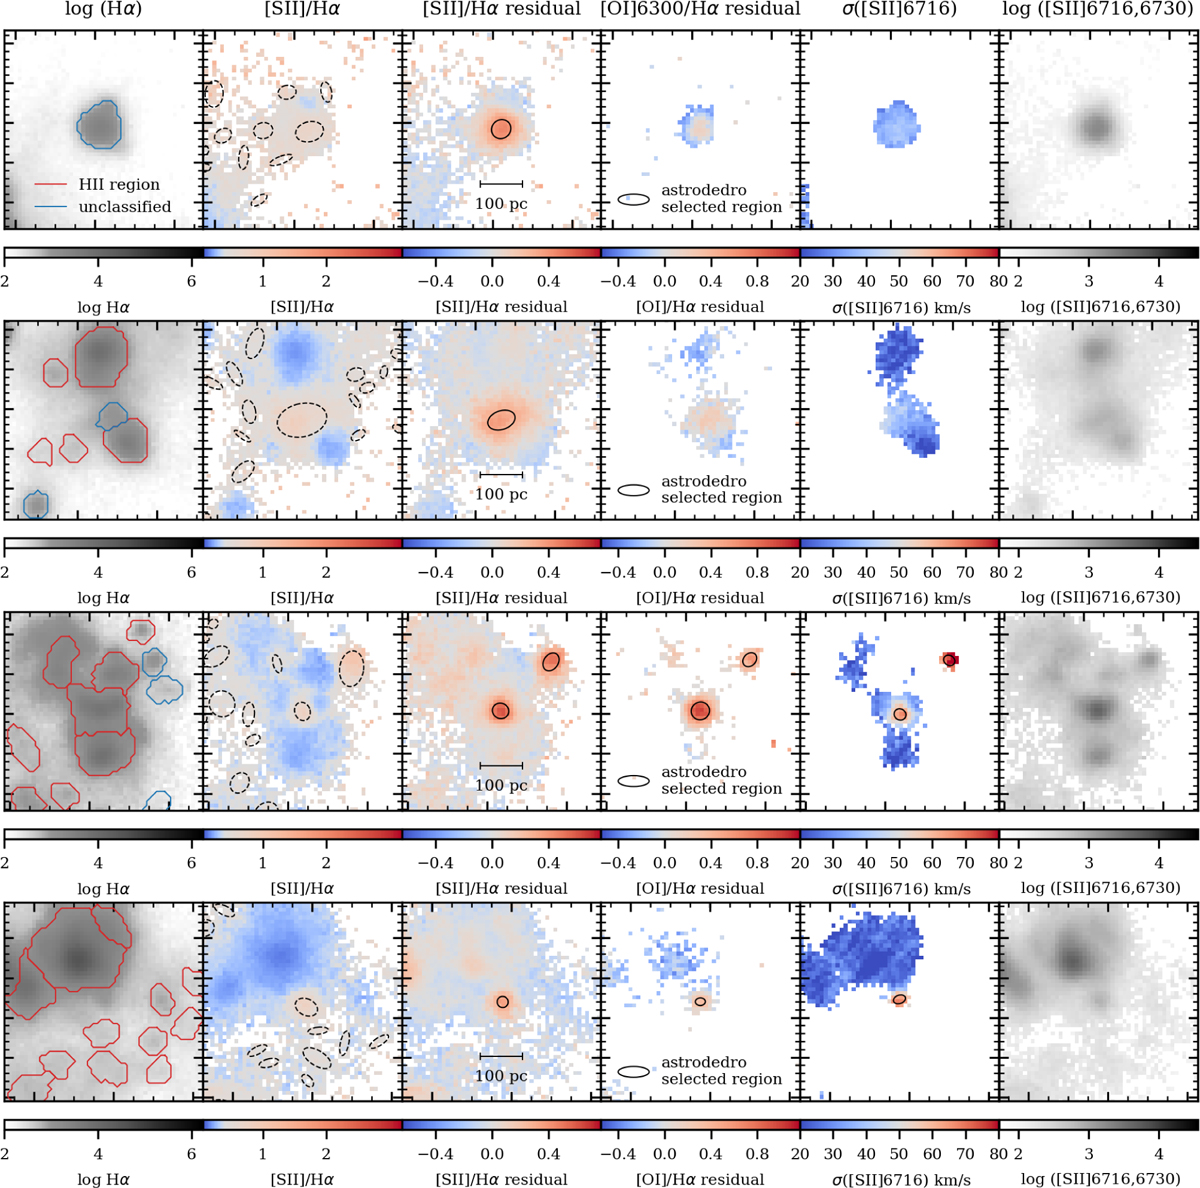
Zoomed-in image on four regions, showing (from left to right) log Hα flux (10−20 cm−2ergs−1), [S II]/Hα, [S II]/Hα residual, [O I]/Hα residual, and [S II] velocity dispersion maps and log [S II] flux. Objects identified by our method as SNRs and SNR candidates are marked with black solid ellipses. Objects identified in the Groves et al. (2023) nebular catalog as H II regions are enclosed by red solid lines, while regions unclassified in that catalog are outlined with blue solid lines. Region contours in the first column are from Groves et al. (2023). The second column shows region contours identified by astrodendro without any photoionization correction. The remaining columns show regions identified by astrodendro after using our final selection methods. It is apparent that many of the regions in the second column are spurious.
Current usage metrics show cumulative count of Article Views (full-text article views including HTML views, PDF and ePub downloads, according to the available data) and Abstracts Views on Vision4Press platform.
Data correspond to usage on the plateform after 2015. The current usage metrics is available 48-96 hours after online publication and is updated daily on week days.
Initial download of the metrics may take a while.