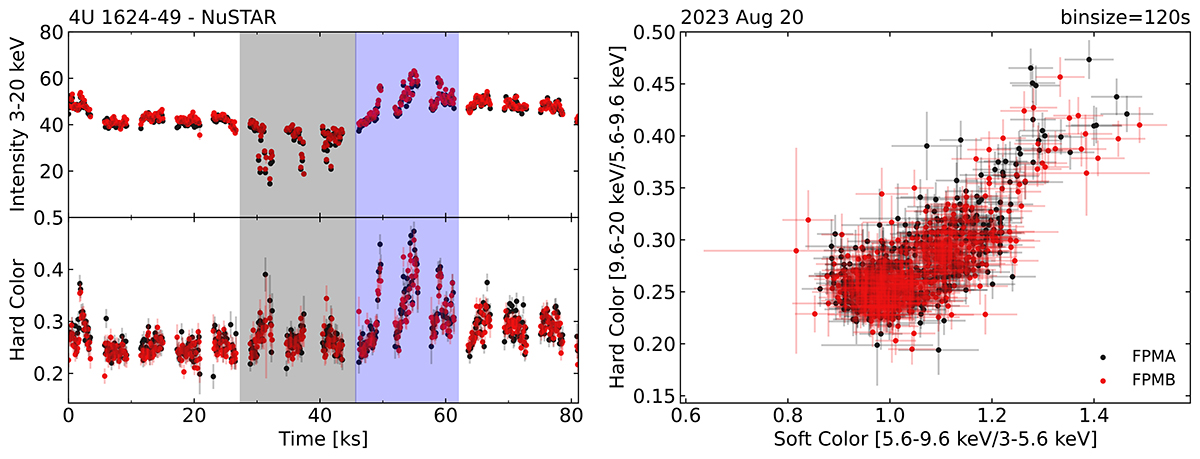
Fig. 2.
Download original image
nustar light curve (left panel) and CCD (right panel) of 4U 1624–49. The soft and hard colors are defined by Eqs. (1) and (2). The gray region corresponds to the dip. The blue region in the light curve highlights the motion of the source along the upper banana branch, corresponding to the points in the upper right part of the CCD diagram. Each bin corresponds to 120 s.
Current usage metrics show cumulative count of Article Views (full-text article views including HTML views, PDF and ePub downloads, according to the available data) and Abstracts Views on Vision4Press platform.
Data correspond to usage on the plateform after 2015. The current usage metrics is available 48-96 hours after online publication and is updated daily on week days.
Initial download of the metrics may take a while.