Fig. 1.
Download original image
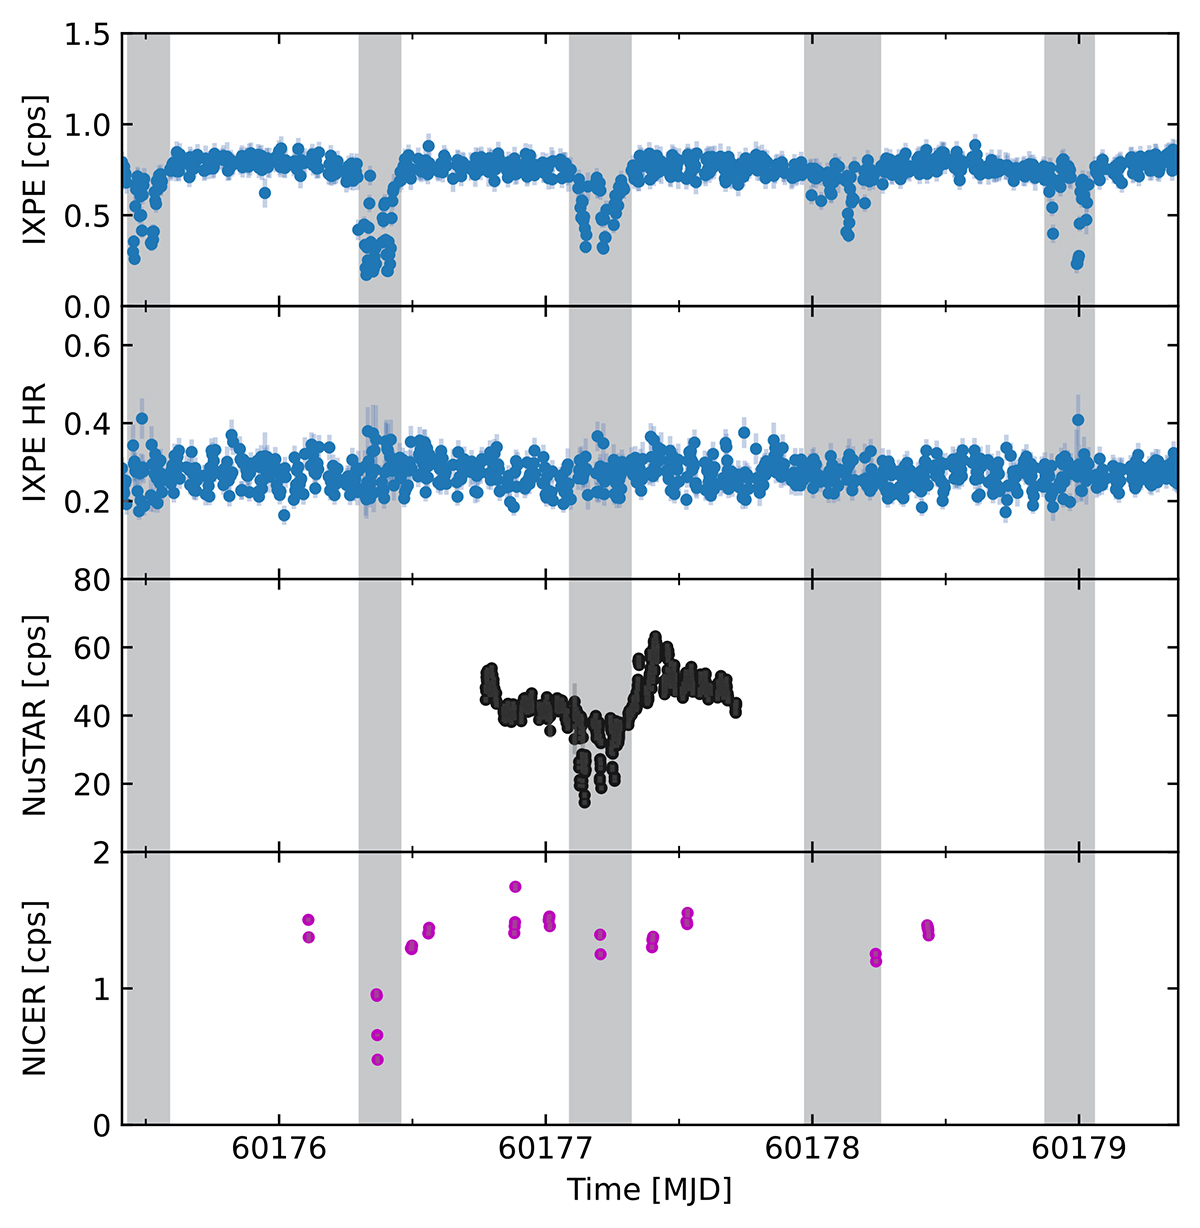
Light curves of 4U 1624–49 during IXPE, NuSTAR, and NICER observations (in count s−1). In the first two rows at the top, the IXPE light curve (per detector) in the 2–8 keV energy band and the HR (5–8 keV/3–5 keV) are shown. In the third row, the NuSTAR 3–20 keV light curve (per detector) is represented. The NICER 0.5–10 keV light curve (per detector) is plotted in the last row. The gray regions correspond to the dips. Each IXPE bin corresponds to 480 s, while for NuSTAR and NICER each bin is 120 s long.
Current usage metrics show cumulative count of Article Views (full-text article views including HTML views, PDF and ePub downloads, according to the available data) and Abstracts Views on Vision4Press platform.
Data correspond to usage on the plateform after 2015. The current usage metrics is available 48-96 hours after online publication and is updated daily on week days.
Initial download of the metrics may take a while.