Open Access
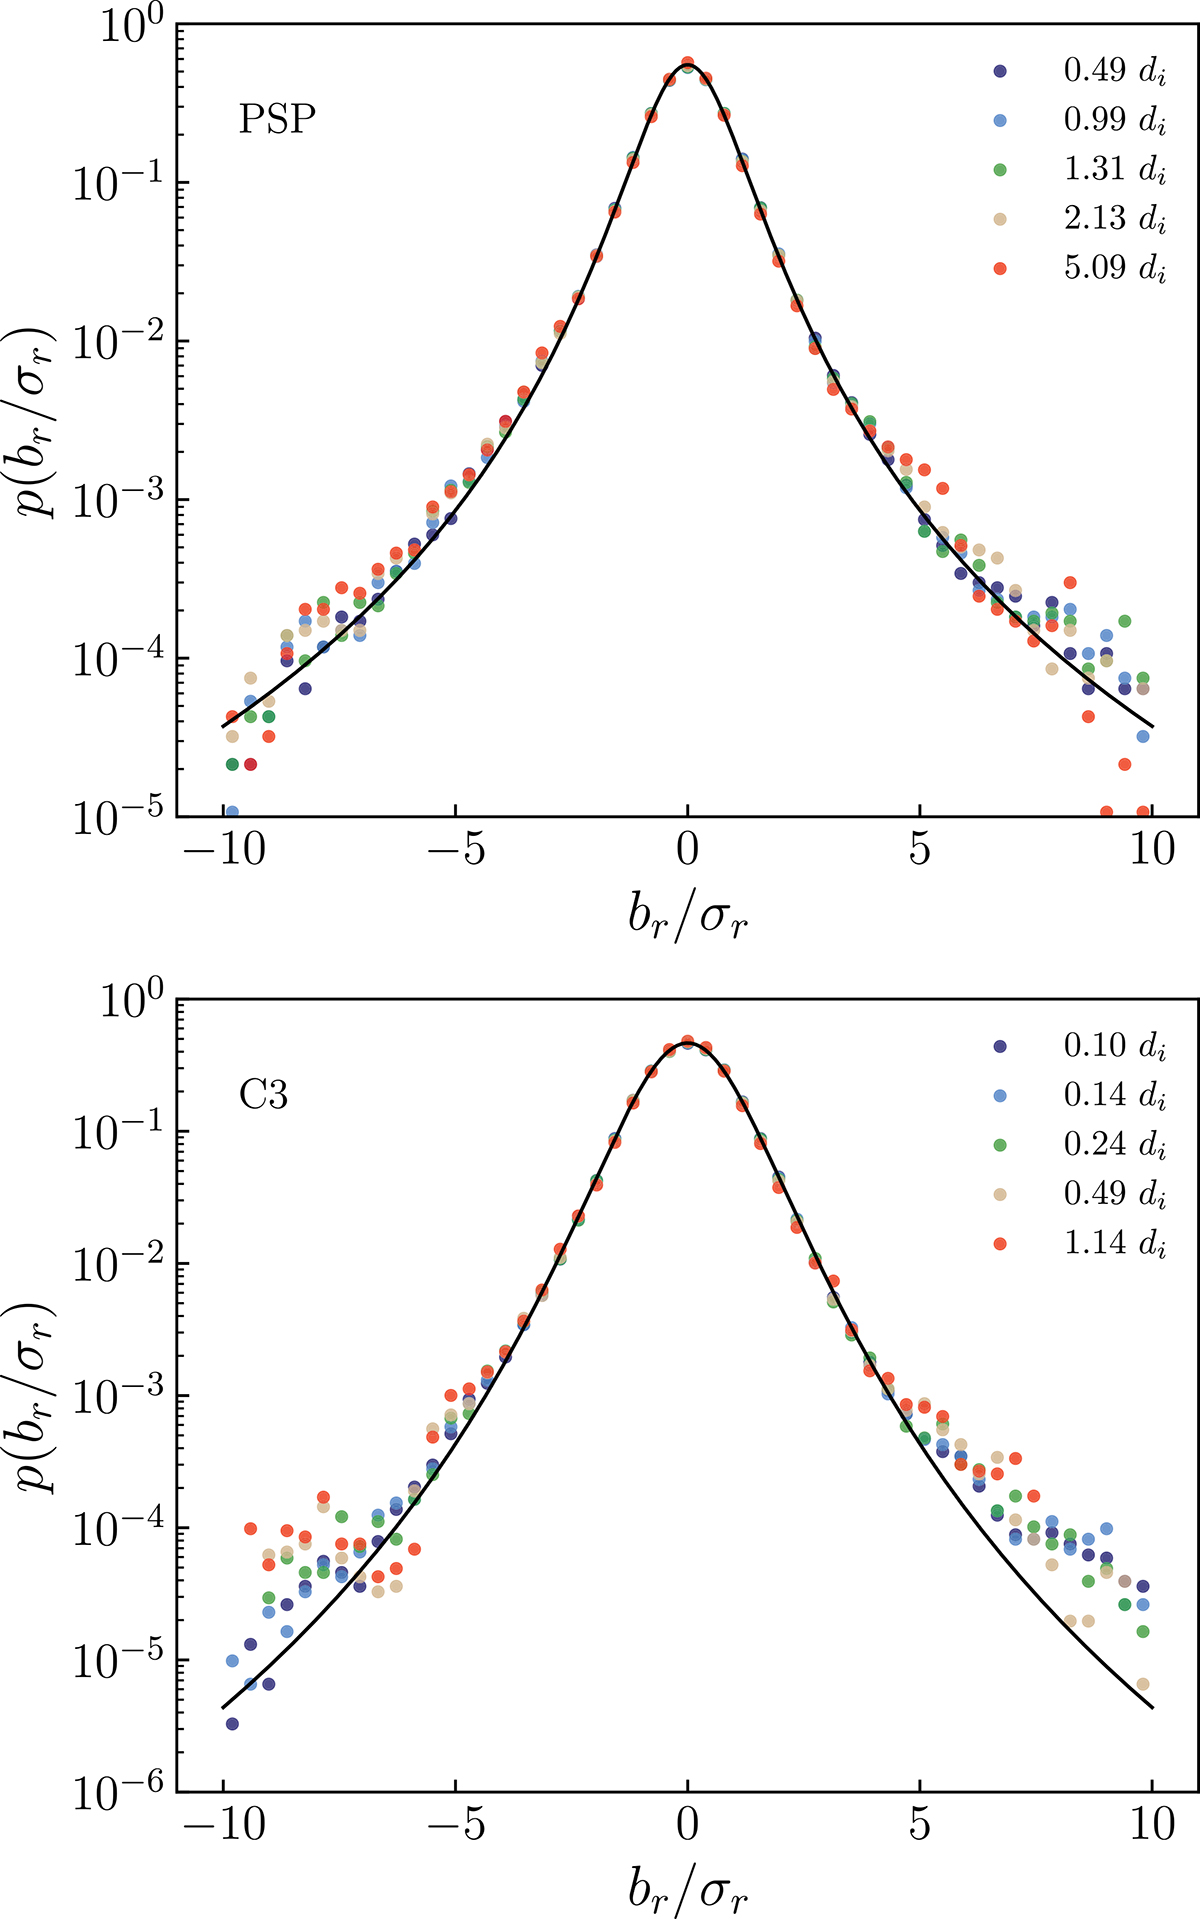
Fig. 6.
Download original image
Magnetic field fluctuation PDFs. The filled circles represent the statistics computed on PSP and C3 measurements at different scales and cover about one order of magnitude in the scale separation r. Theoretical predictions provided by the Kappa distribution are indicated by solid lines.
Current usage metrics show cumulative count of Article Views (full-text article views including HTML views, PDF and ePub downloads, according to the available data) and Abstracts Views on Vision4Press platform.
Data correspond to usage on the plateform after 2015. The current usage metrics is available 48-96 hours after online publication and is updated daily on week days.
Initial download of the metrics may take a while.