Open Access
Fig. 4.
Download original image
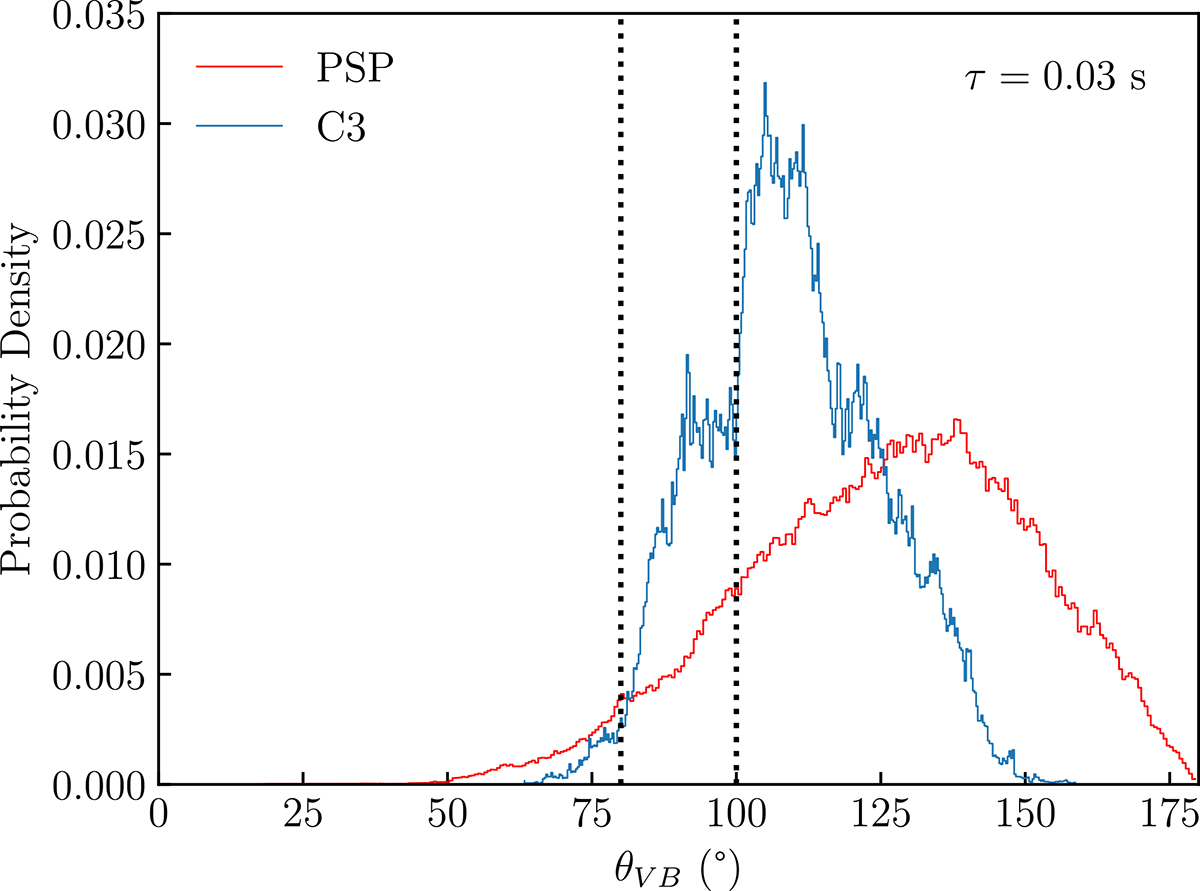
Histograms of the angle θVB between the local mean magnetic field and the sampling direction for the PSP and C3 data samples. The statistics have been calculated at scale τ = 0.03 s, and the vertical lines delineate the region 80° < θVB < 100° around the perpendicular direction.
Current usage metrics show cumulative count of Article Views (full-text article views including HTML views, PDF and ePub downloads, according to the available data) and Abstracts Views on Vision4Press platform.
Data correspond to usage on the plateform after 2015. The current usage metrics is available 48-96 hours after online publication and is updated daily on week days.
Initial download of the metrics may take a while.