Fig. 3.
Download original image
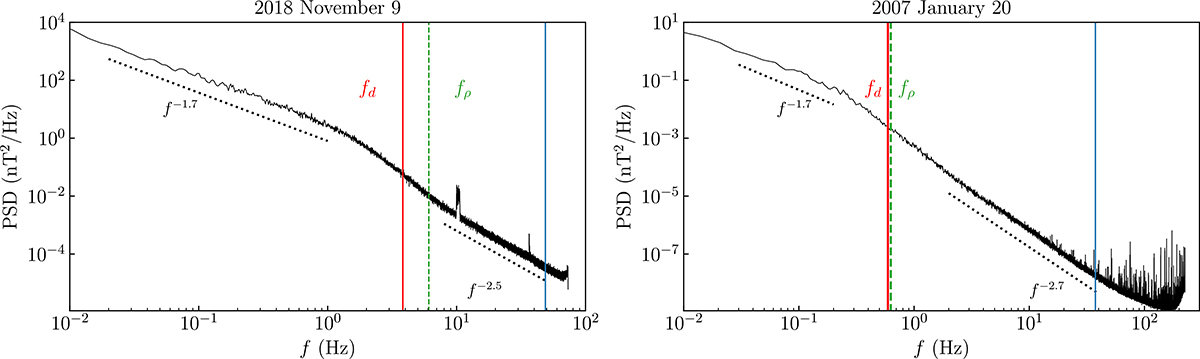
Power spectral density of the 2018 November 9 PSP data interval (left) and of the 2007 January 20 C3 data sample (right). Vertical lines indicate frequencies associated with the ion inertial length (red) and the ion gyroradius (green). The blue lines indicate the smallest scales considered in the analysis. The typical slopes in the inertial and kinetic ranges are reported for reference (dotted lines).
Current usage metrics show cumulative count of Article Views (full-text article views including HTML views, PDF and ePub downloads, according to the available data) and Abstracts Views on Vision4Press platform.
Data correspond to usage on the plateform after 2015. The current usage metrics is available 48-96 hours after online publication and is updated daily on week days.
Initial download of the metrics may take a while.