Open Access
Fig. 6
Download original image
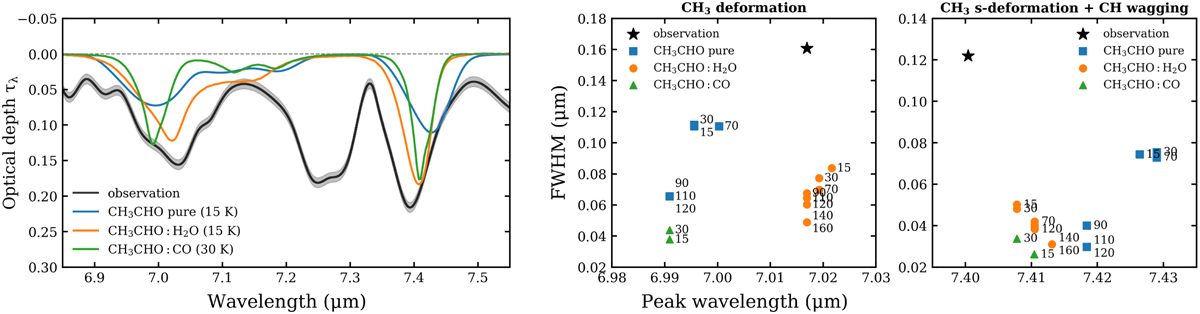
Two methods of selecting the best-fit ice mixture, taking CH3CHO as an example. The left panel shows the direct comparison of spectral profiles between observations and experiments. The middle and the right panels show the comparison of peak position and FWHM of absorption bands between lab spectra and observations.
Current usage metrics show cumulative count of Article Views (full-text article views including HTML views, PDF and ePub downloads, according to the available data) and Abstracts Views on Vision4Press platform.
Data correspond to usage on the plateform after 2015. The current usage metrics is available 48-96 hours after online publication and is updated daily on week days.
Initial download of the metrics may take a while.