Open Access
Fig. F.1
Download original image
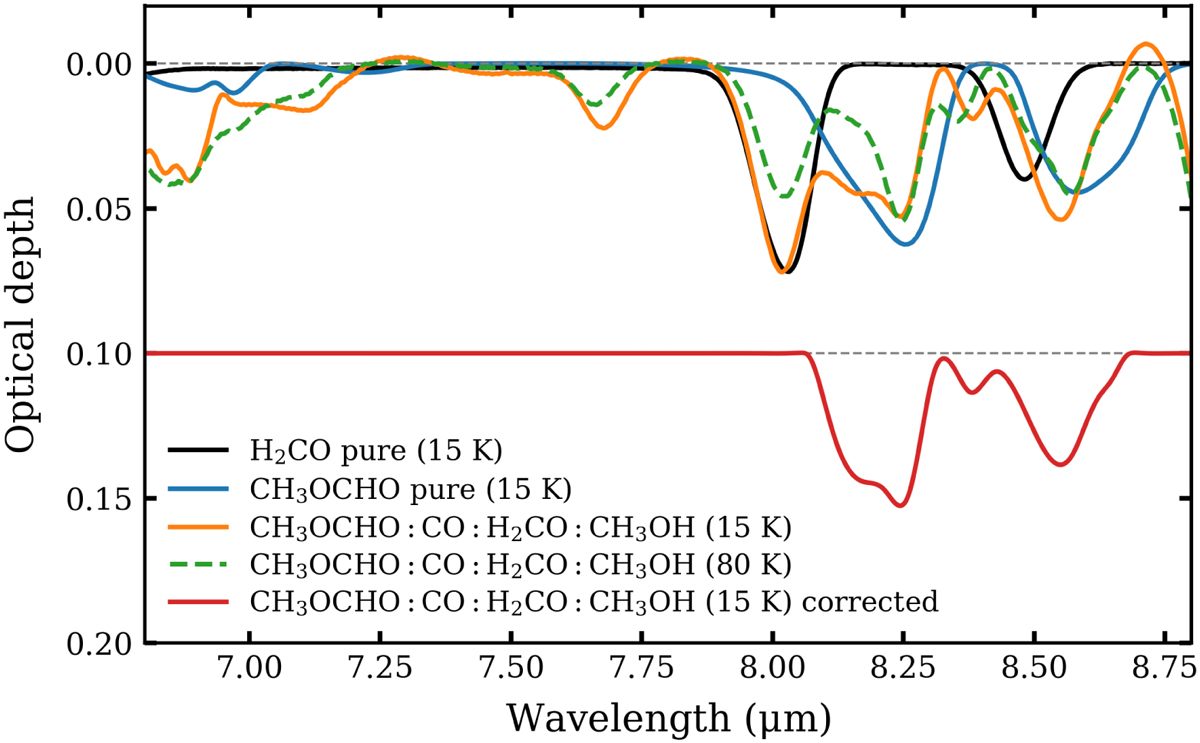
Comparison between the lab spectra of pure H2CO ice (black), pure CH3OCHO ice (blue), and CH3OCHO:CO:H2CO:CH3OH mixture under 15 K (orange) and 80 K (dashed green). The corrected spectrum for the CH3OCHO mixture under 15 K (red) is plotted at an offset place.
Current usage metrics show cumulative count of Article Views (full-text article views including HTML views, PDF and ePub downloads, according to the available data) and Abstracts Views on Vision4Press platform.
Data correspond to usage on the plateform after 2015. The current usage metrics is available 48-96 hours after online publication and is updated daily on week days.
Initial download of the metrics may take a while.