Fig. 7
Download original image
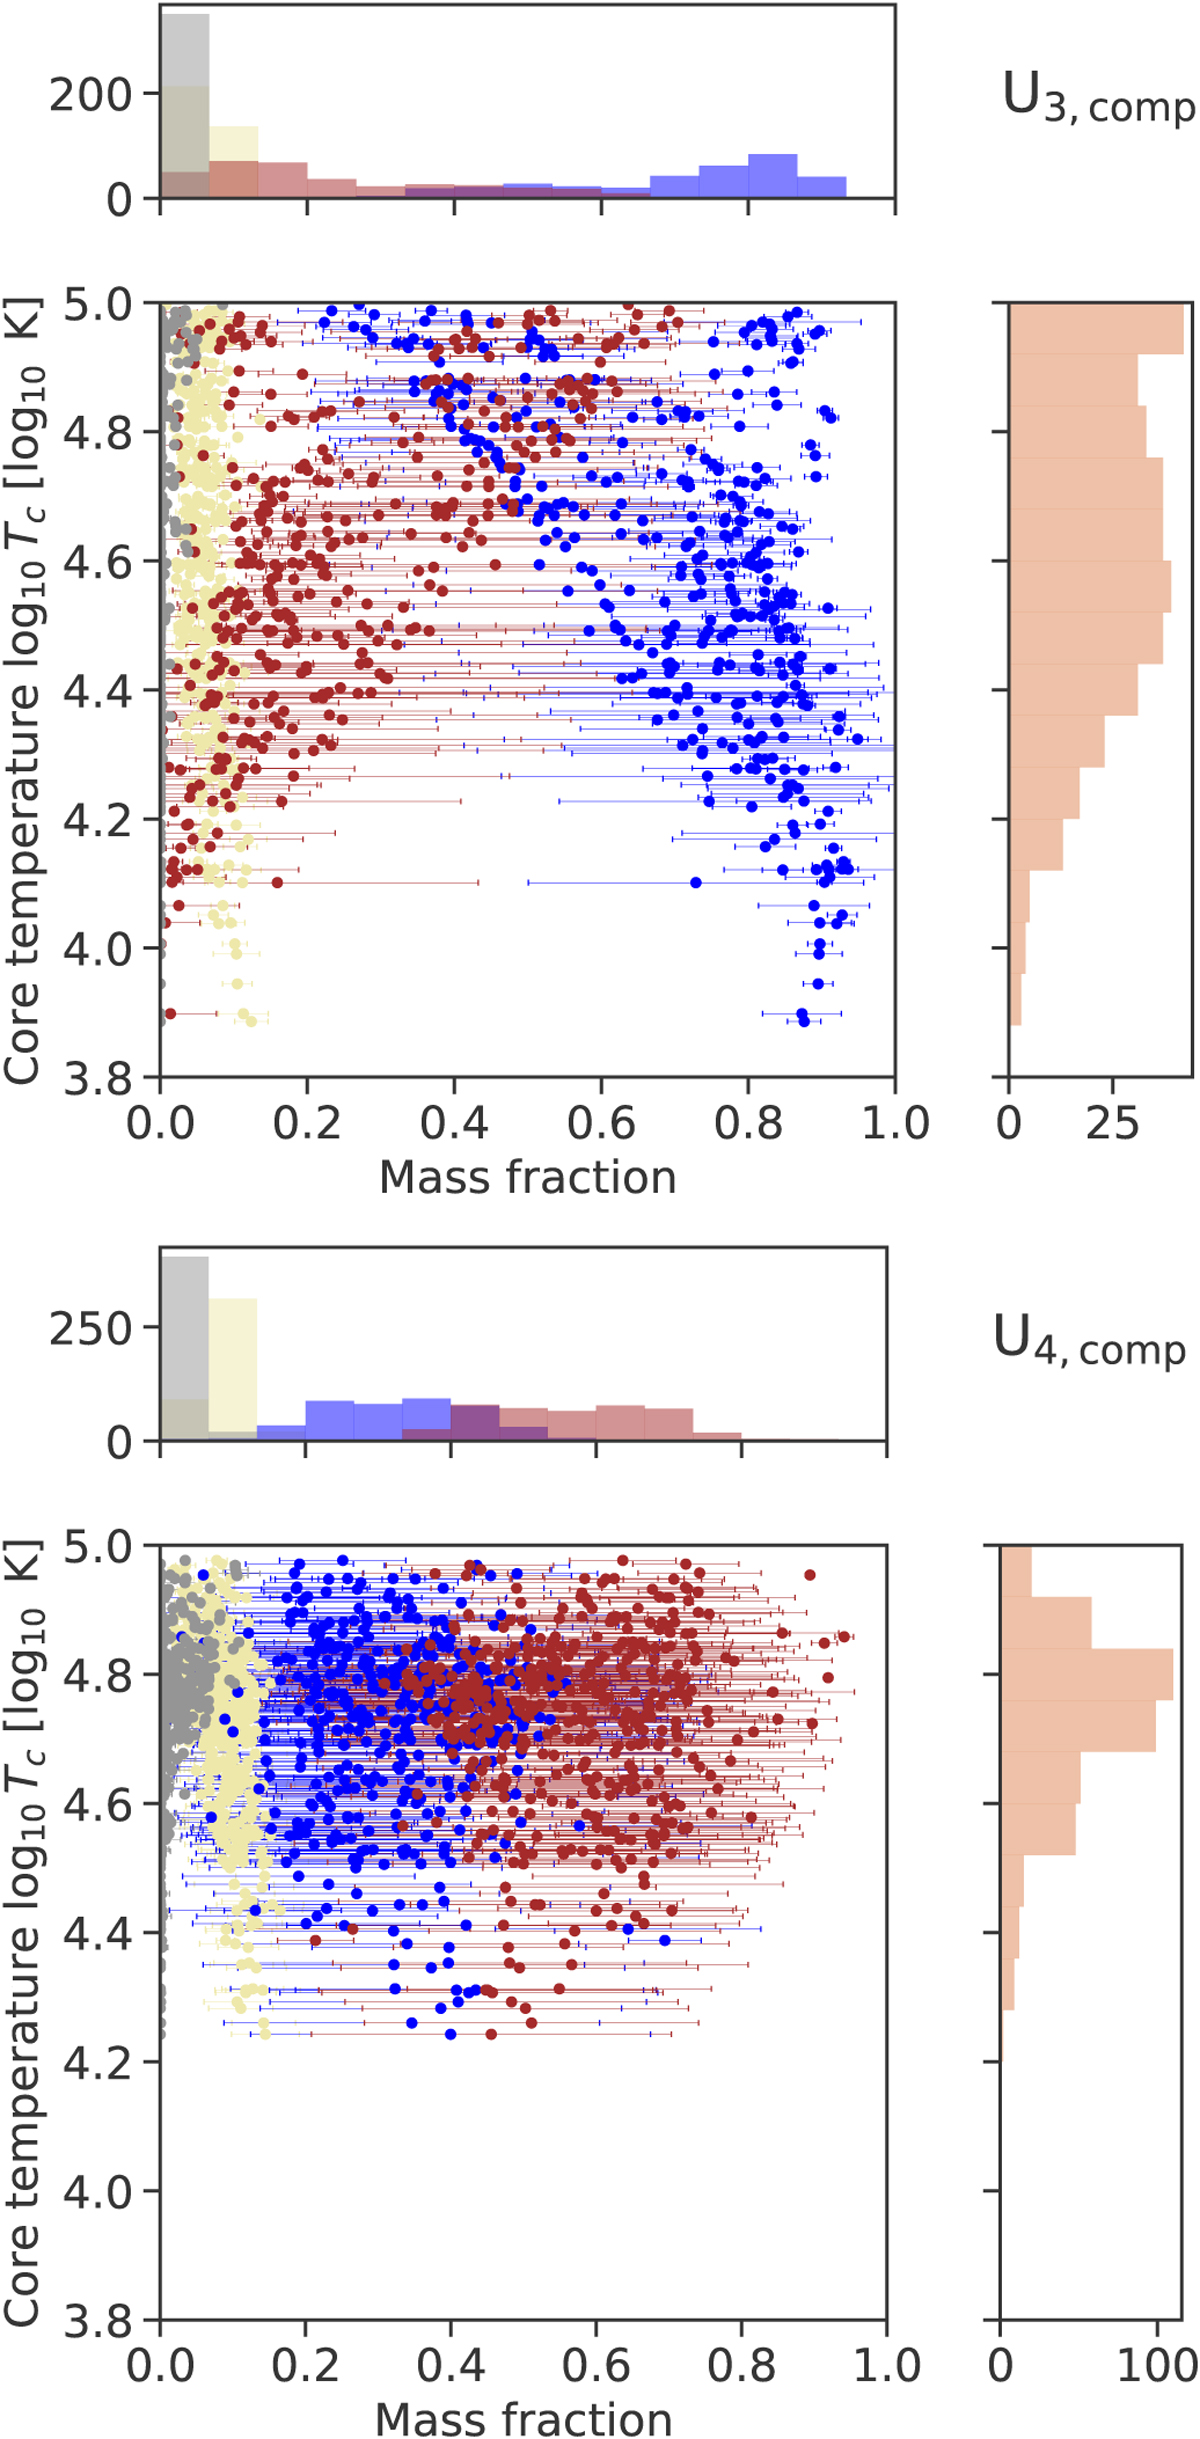
Inferred composition and temperature for our Uranus empirical models for U3,comp (top) and U4,comp (bottom). The x-axis corresponds to the mass fraction of a material and the y-axis shows the central temperature. The colours represent different materials (see legend of Figure 6) and the error bars indicate the 1σ range of solutions found by the random algorithm for each density profile. To improve readability, error bars for the central temperature Tc are not shown. They are included in Figure 11.
Current usage metrics show cumulative count of Article Views (full-text article views including HTML views, PDF and ePub downloads, according to the available data) and Abstracts Views on Vision4Press platform.
Data correspond to usage on the plateform after 2015. The current usage metrics is available 48-96 hours after online publication and is updated daily on week days.
Initial download of the metrics may take a while.