Fig. 6
Download original image
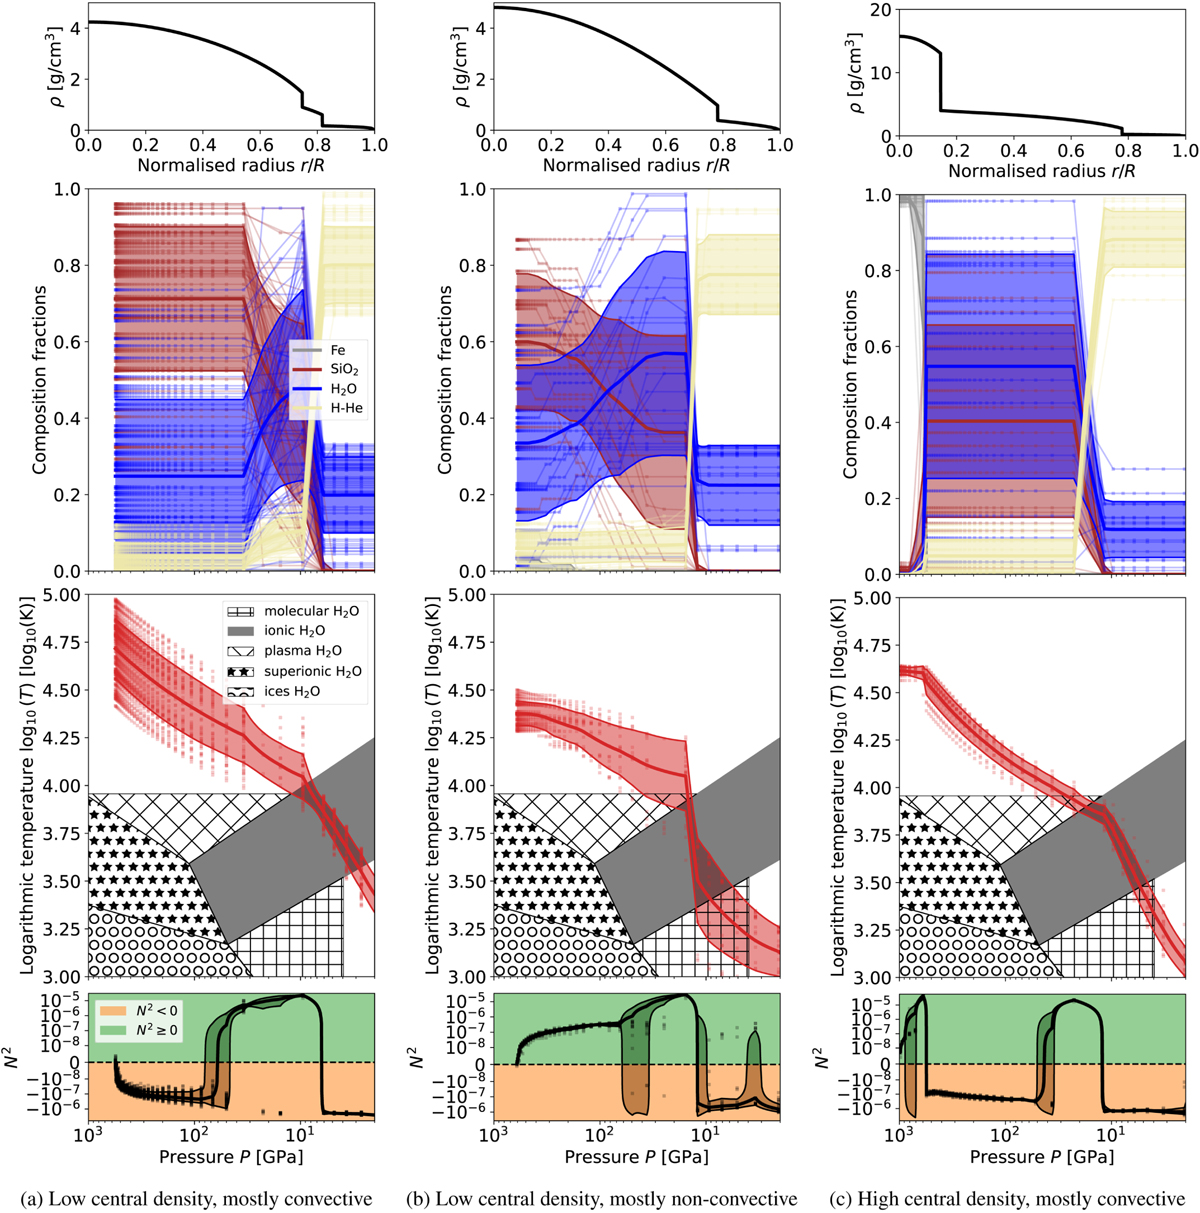
Three example empirical density profiles of Uranus (depicted from left to right). Their density, composition, and temperature profile inferred by the new random algorithm is depicted from top to bottom, respectively. The extended phase diagram of water based on Redmer et al. (2011) is shown in addition to the temperature profiles. The stability against convection is presented using the Brunt-Väisälä frequency N2 in the bottom last plots.
Current usage metrics show cumulative count of Article Views (full-text article views including HTML views, PDF and ePub downloads, according to the available data) and Abstracts Views on Vision4Press platform.
Data correspond to usage on the plateform after 2015. The current usage metrics is available 48-96 hours after online publication and is updated daily on week days.
Initial download of the metrics may take a while.