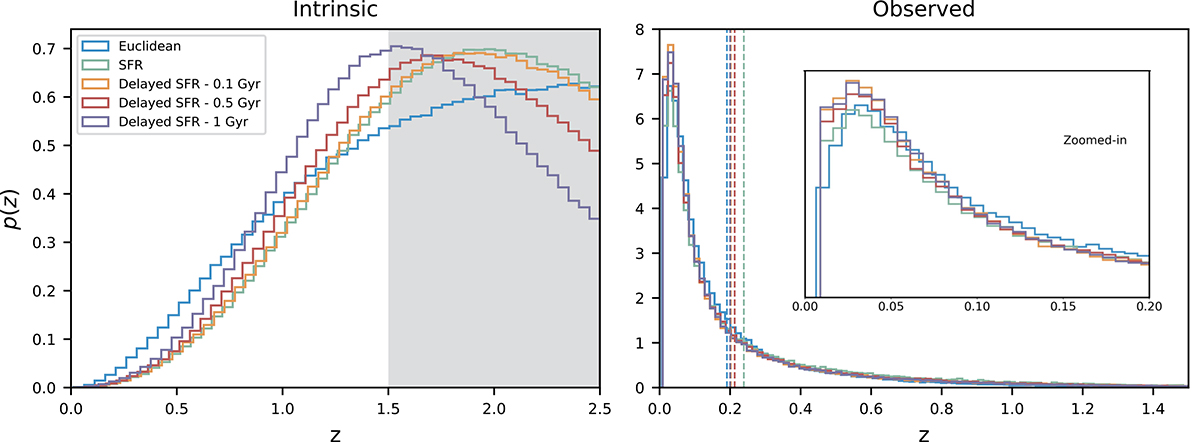
Fig. 8.
Download original image
Probability distributions of FRBs as functions of redshift for different models. Left panel: probability density functions (PDFs) of the intrinsic FRB population versus redshift, for the Euclidean, SFR and delayed SFR models with three delay times. The redshift range [0, 1.5] is used in our simulation. For information, we also show the region [1.5, 2.5], gray shaded, such that the shift of the SFR peak is visible between the models. Right panel: simulated observed FRB population PDFs against redshift, for the same models. The mean redshift ⟨z⟩ for the different models are marked by the dashed vertical lines. An unfilled zoomed-in view of the redshift range [0, 0.2] is also shown.
Current usage metrics show cumulative count of Article Views (full-text article views including HTML views, PDF and ePub downloads, according to the available data) and Abstracts Views on Vision4Press platform.
Data correspond to usage on the plateform after 2015. The current usage metrics is available 48-96 hours after online publication and is updated daily on week days.
Initial download of the metrics may take a while.