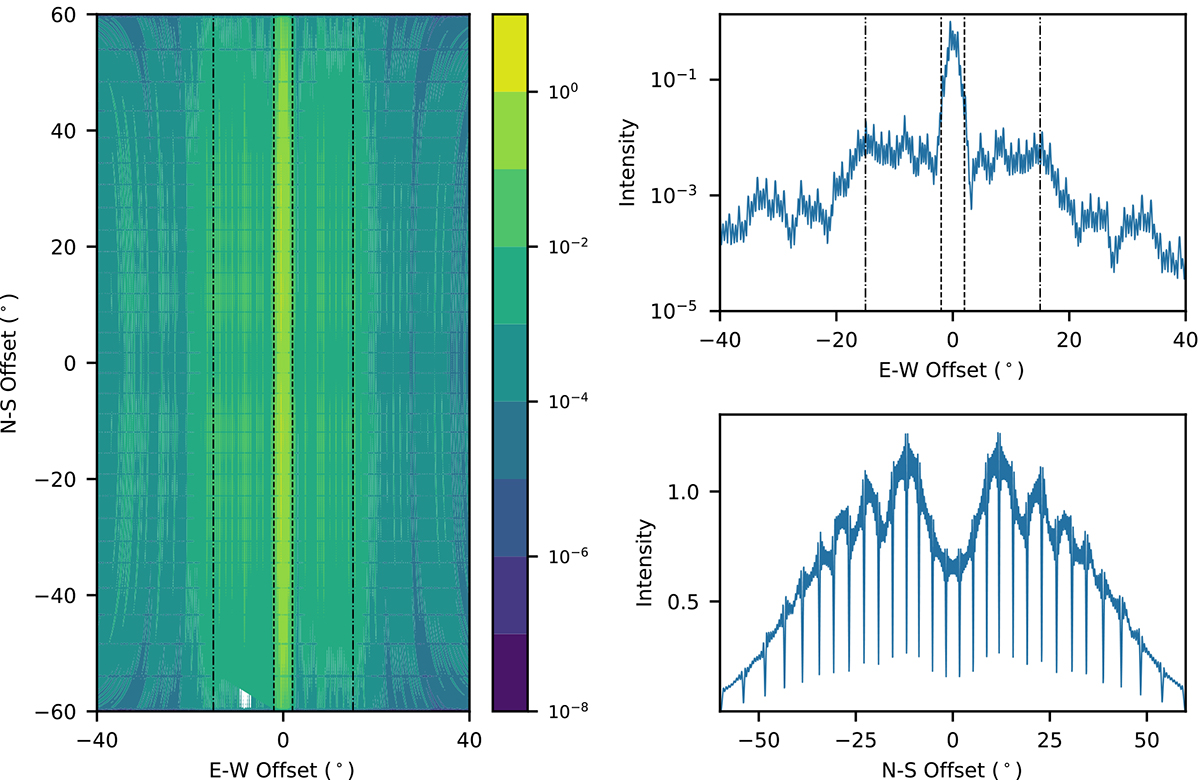
Fig. 3.
Download original image
CHIME/FRB beam model reproduced with cfbm at 600 MHz. The left panel shows the beam intensity map in the range [ − 40° ,40° ] (East-West) and [ − 60° ,60° ] (North-South). The upper and bottom right panels show the East-West slice (y = 0°) and North-South slice along the meridian (x = 0°) respectively. The relative beam intensity is dimensionless, and normalized to the transit of Cyg A (Amiri et al. 2022). To include the side-lobe in our simulation, the beam range [ − 15° ,15° ] (East-West) × [−60° ,60° ] (North-South) is considered, where the East-West borders are indicated with dash-dotted lines.
Current usage metrics show cumulative count of Article Views (full-text article views including HTML views, PDF and ePub downloads, according to the available data) and Abstracts Views on Vision4Press platform.
Data correspond to usage on the plateform after 2015. The current usage metrics is available 48-96 hours after online publication and is updated daily on week days.
Initial download of the metrics may take a while.