Open Access
Fig. 15.
Download original image
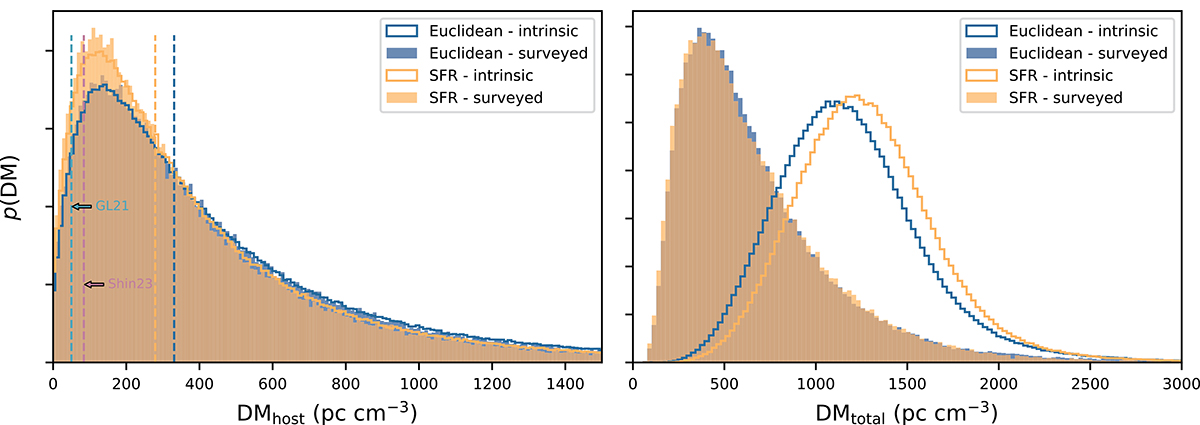
Probability distribution of DMhost (left) in the source frame, and DMtotal (right) before (intrinsic) and after (surveyed) detection in our simulation. The median DMhost found by GL21, Shin et al. (2023) and this work are indicated with vertical dashed lines. The y axes are in linear scale.
Current usage metrics show cumulative count of Article Views (full-text article views including HTML views, PDF and ePub downloads, according to the available data) and Abstracts Views on Vision4Press platform.
Data correspond to usage on the plateform after 2015. The current usage metrics is available 48-96 hours after online publication and is updated daily on week days.
Initial download of the metrics may take a while.