Fig. 12.
Download original image
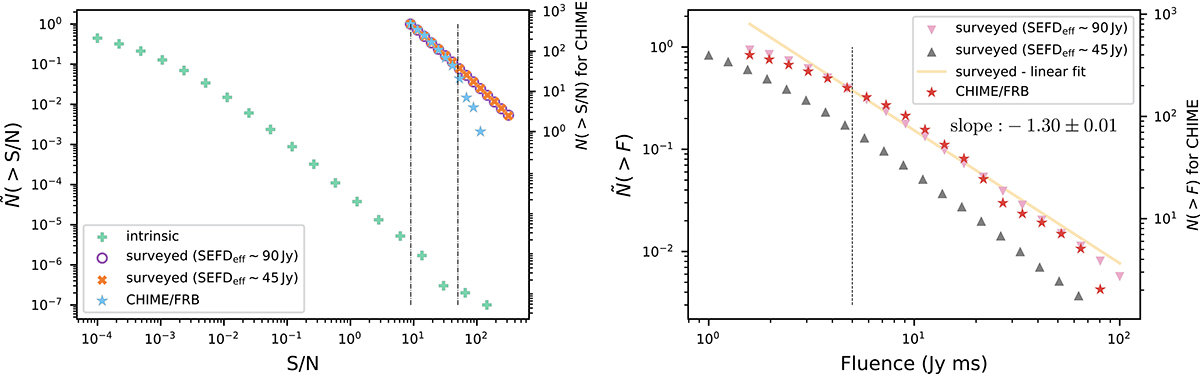
Cumulative distribution of the S/Ns and fluences of FRBs in the SFR model. On the right ordinates, the number N detectable/detected for CHIME. On the left ordinate, the fraction of this number over the total, ![]() . Left panel: plot of N(> S/N) versus S/N. The two simulated populations, surveyed with different SEFDeff, are shown with cross and circle markers, while the CHIME/FRB Catalog 1 is represented using star markers. The S/N “underlying” distribution is generated using a threshold below the minimum range of this plot. The intrinsic and both surveyed populations have the same slope, indicating a scale-invariant feature despite selection effects and different telescope sensitivity. The vertical dash-dotted lines mark the S/N for the CHIME/FRB S/N threshold and for the start of the high-S/N deviation from our surveyed populations, respectively. Right panel: N(> F)−F plot. The surveyed population with different SEFDeff and CHIME/FRB Catalog 1 are shown in triangle down, triangle up and star markers respectively; the linear fit to surveyed population SEFDeff ∼ 90 Jy has a slope −1.30 ± 0.01. The vertical dashed line at 5 Jy ms marks the lower bound used in our comparison of fluence distributions.
. Left panel: plot of N(> S/N) versus S/N. The two simulated populations, surveyed with different SEFDeff, are shown with cross and circle markers, while the CHIME/FRB Catalog 1 is represented using star markers. The S/N “underlying” distribution is generated using a threshold below the minimum range of this plot. The intrinsic and both surveyed populations have the same slope, indicating a scale-invariant feature despite selection effects and different telescope sensitivity. The vertical dash-dotted lines mark the S/N for the CHIME/FRB S/N threshold and for the start of the high-S/N deviation from our surveyed populations, respectively. Right panel: N(> F)−F plot. The surveyed population with different SEFDeff and CHIME/FRB Catalog 1 are shown in triangle down, triangle up and star markers respectively; the linear fit to surveyed population SEFDeff ∼ 90 Jy has a slope −1.30 ± 0.01. The vertical dashed line at 5 Jy ms marks the lower bound used in our comparison of fluence distributions.
Current usage metrics show cumulative count of Article Views (full-text article views including HTML views, PDF and ePub downloads, according to the available data) and Abstracts Views on Vision4Press platform.
Data correspond to usage on the plateform after 2015. The current usage metrics is available 48-96 hours after online publication and is updated daily on week days.
Initial download of the metrics may take a while.