Fig. 11.
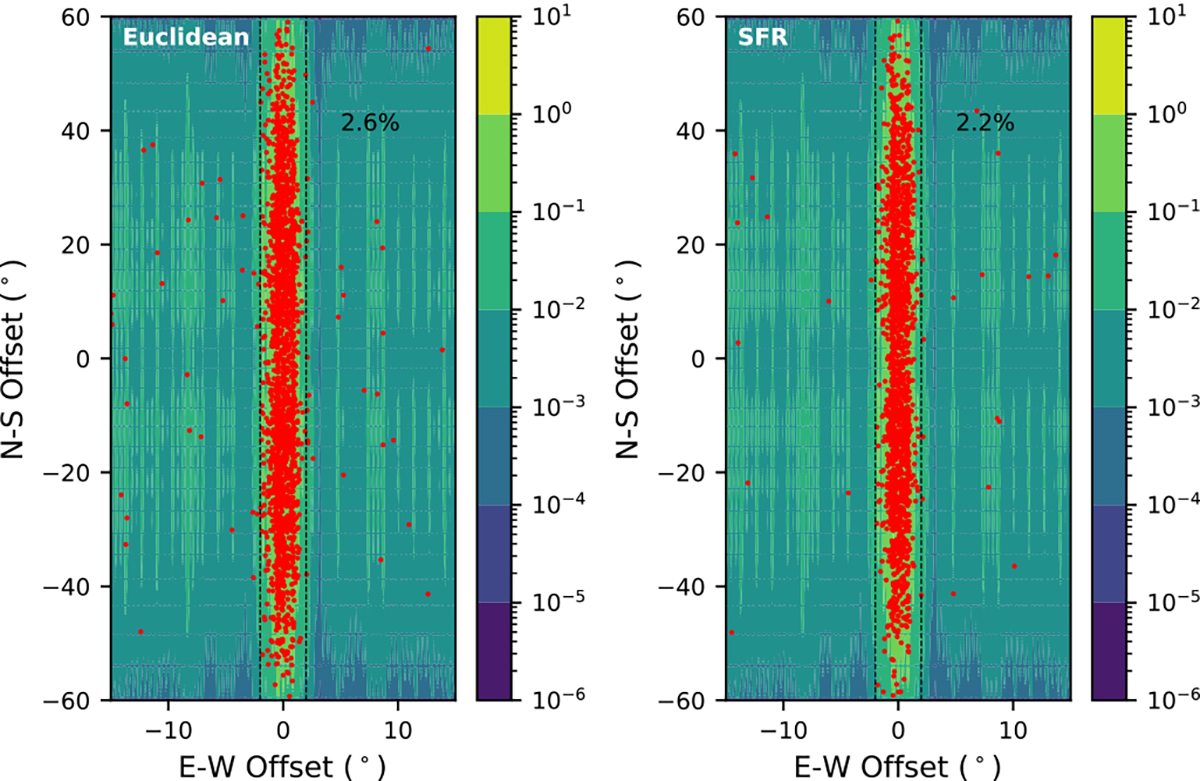
Download original image
Detection locations of simulated FRBs in the CHIME beam map (at 600 MHz). The left and right panels are results of the Euclidean and SFR number density model respectively. The vertical dashed lines mark the chosen boundary (±2.0°) of the main-lobe. Side-lobe detections account for ∼2.6% and ∼2.2% in the Euclidean and SFR models respectively, based on the average of 50 realizations. The beam intensity is normalized as in Fig. 3.
Current usage metrics show cumulative count of Article Views (full-text article views including HTML views, PDF and ePub downloads, according to the available data) and Abstracts Views on Vision4Press platform.
Data correspond to usage on the plateform after 2015. The current usage metrics is available 48-96 hours after online publication and is updated daily on week days.
Initial download of the metrics may take a while.