Fig. 10.
Download original image
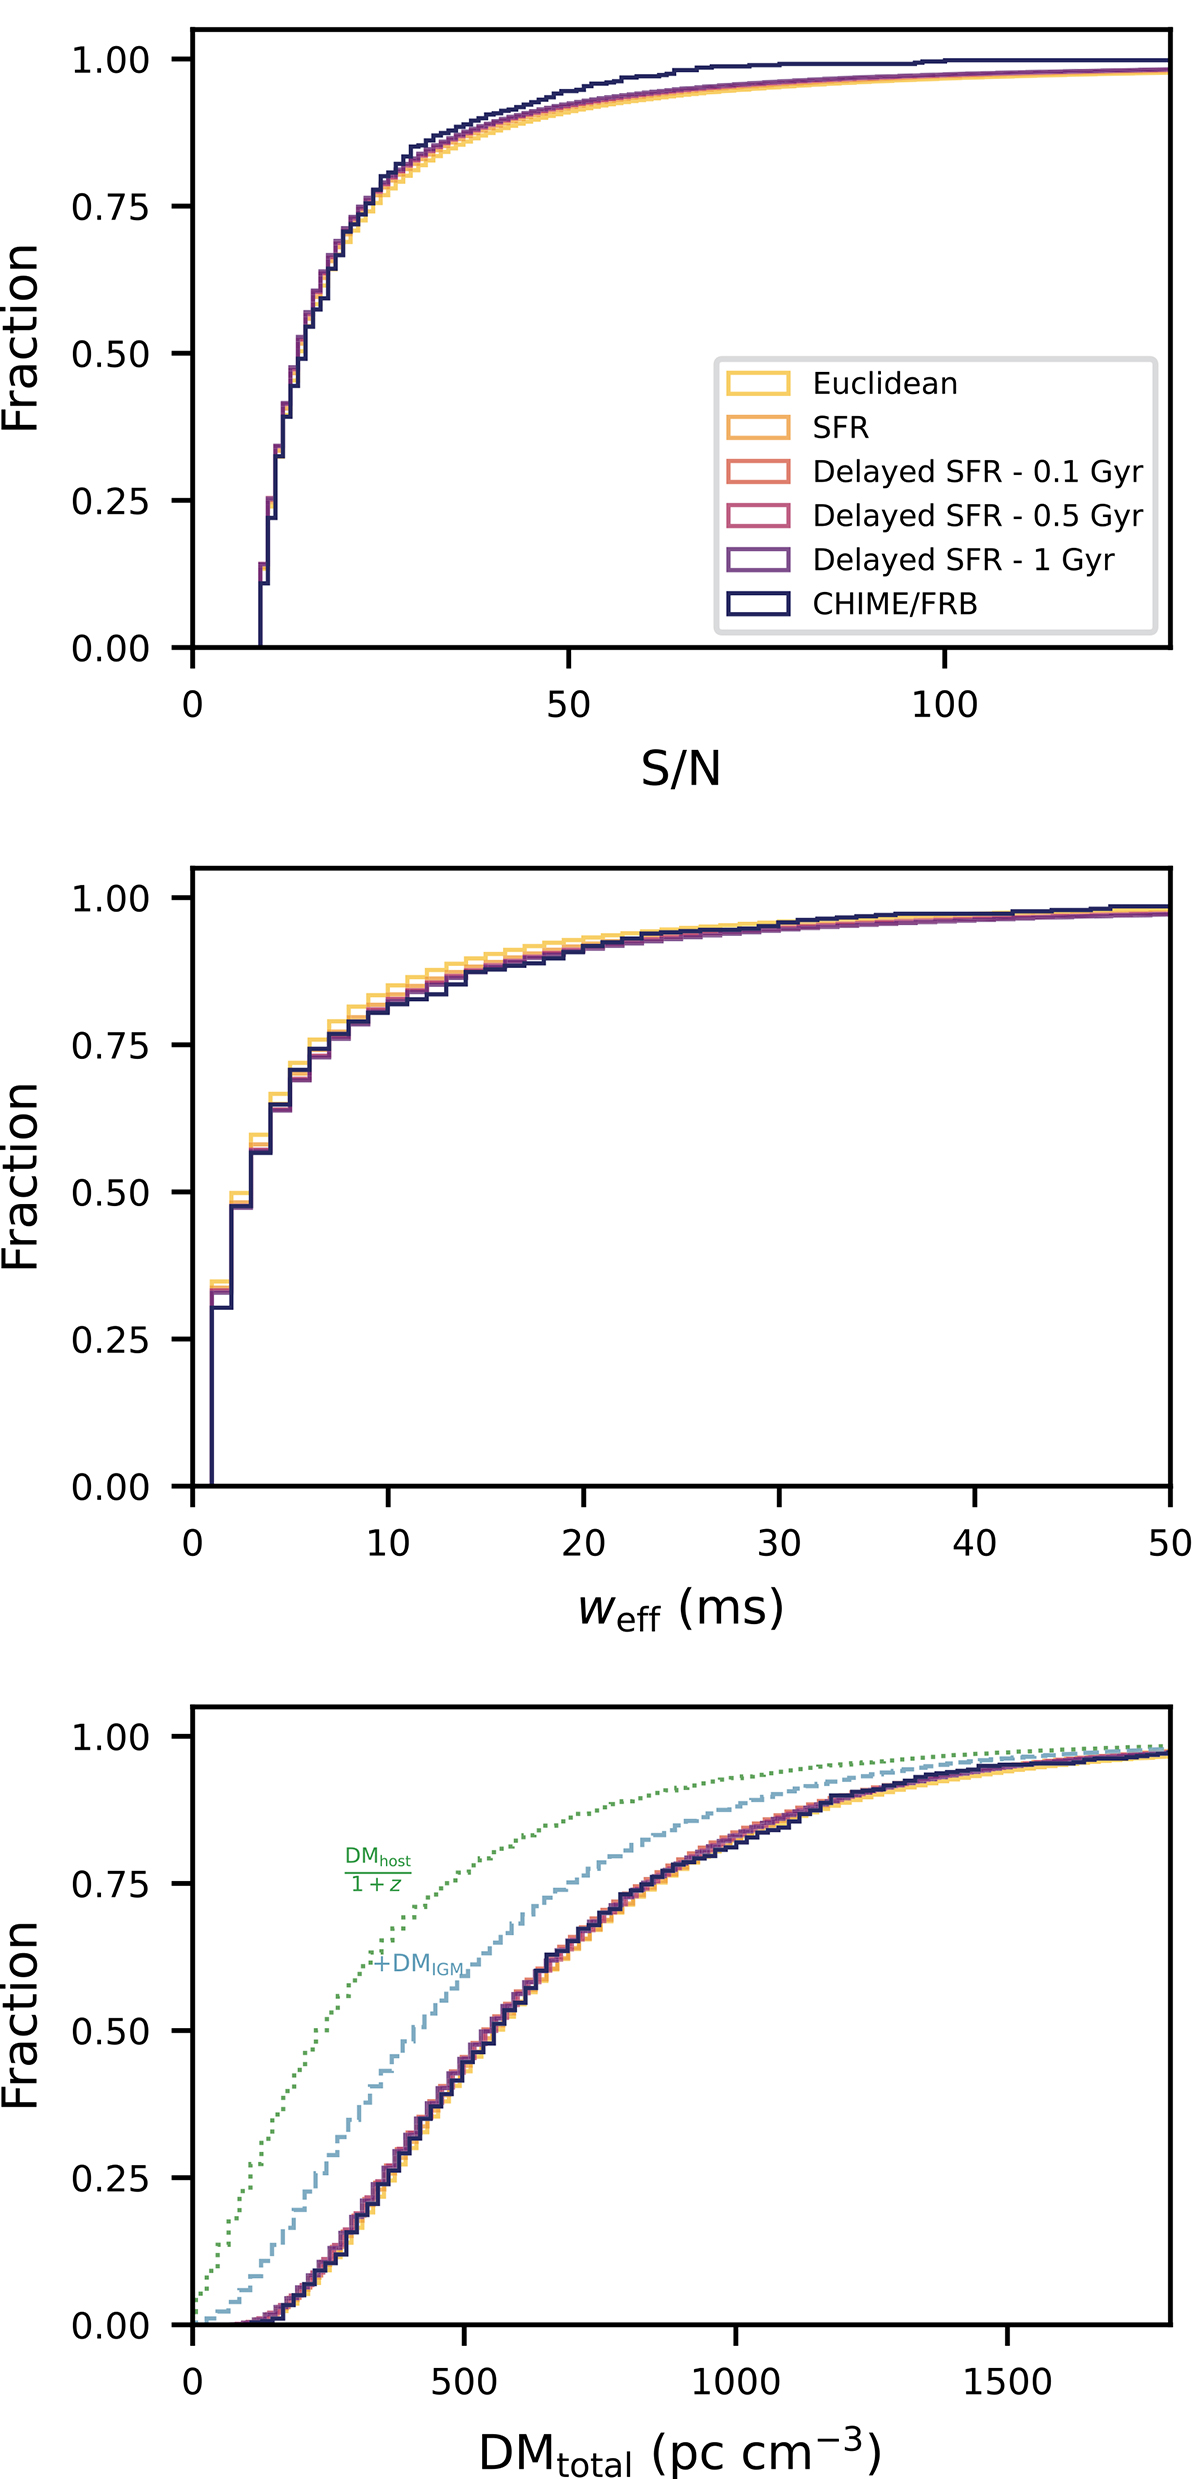
Comparison of cumulative distributions for simulated populations with best-fitting parameters and the CHIME/FRB Catalog 1 one-off FRBs. The S/N, weff and DMtotal are shown in upper, middle and lower panels respectively. The population coloring is the same in all subplots. In the DM plot we also show the cumulative contributions of DMhost/(1 + z), and of the additional DMIGM, for the delayed SFR model with 0.1 Gyr. These show how, for the lower-DM half of the population, these two components contribute roughly equally to the DMtotal; while for the higher-DM half, the host contribution dominates.
Current usage metrics show cumulative count of Article Views (full-text article views including HTML views, PDF and ePub downloads, according to the available data) and Abstracts Views on Vision4Press platform.
Data correspond to usage on the plateform after 2015. The current usage metrics is available 48-96 hours after online publication and is updated daily on week days.
Initial download of the metrics may take a while.