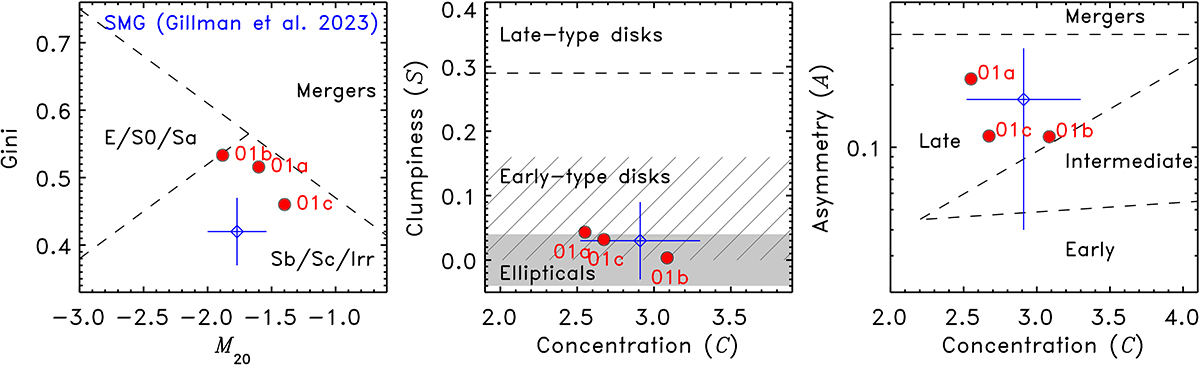
Fig. C.2.
Download original image
Morphological parameters of the three CO emitters (filled red circles). Dashed lines and shaded regions show the division between different morphological types as defined by Lotz et al. (2008b) in the Gini-M20 plane (left panel), by Conselice (2003) in the S − C plane (middle panel), and by Bershady et al. (2000) in the A − C plane (right panel). The blue diamond represents the median value measured on JWST NIR images for a sample of SMGs (Gillman et al. 2023) with error bars indicating the sample standard deviation of each parameter.
Current usage metrics show cumulative count of Article Views (full-text article views including HTML views, PDF and ePub downloads, according to the available data) and Abstracts Views on Vision4Press platform.
Data correspond to usage on the plateform after 2015. The current usage metrics is available 48-96 hours after online publication and is updated daily on week days.
Initial download of the metrics may take a while.