Fig. A.1.
Download original image
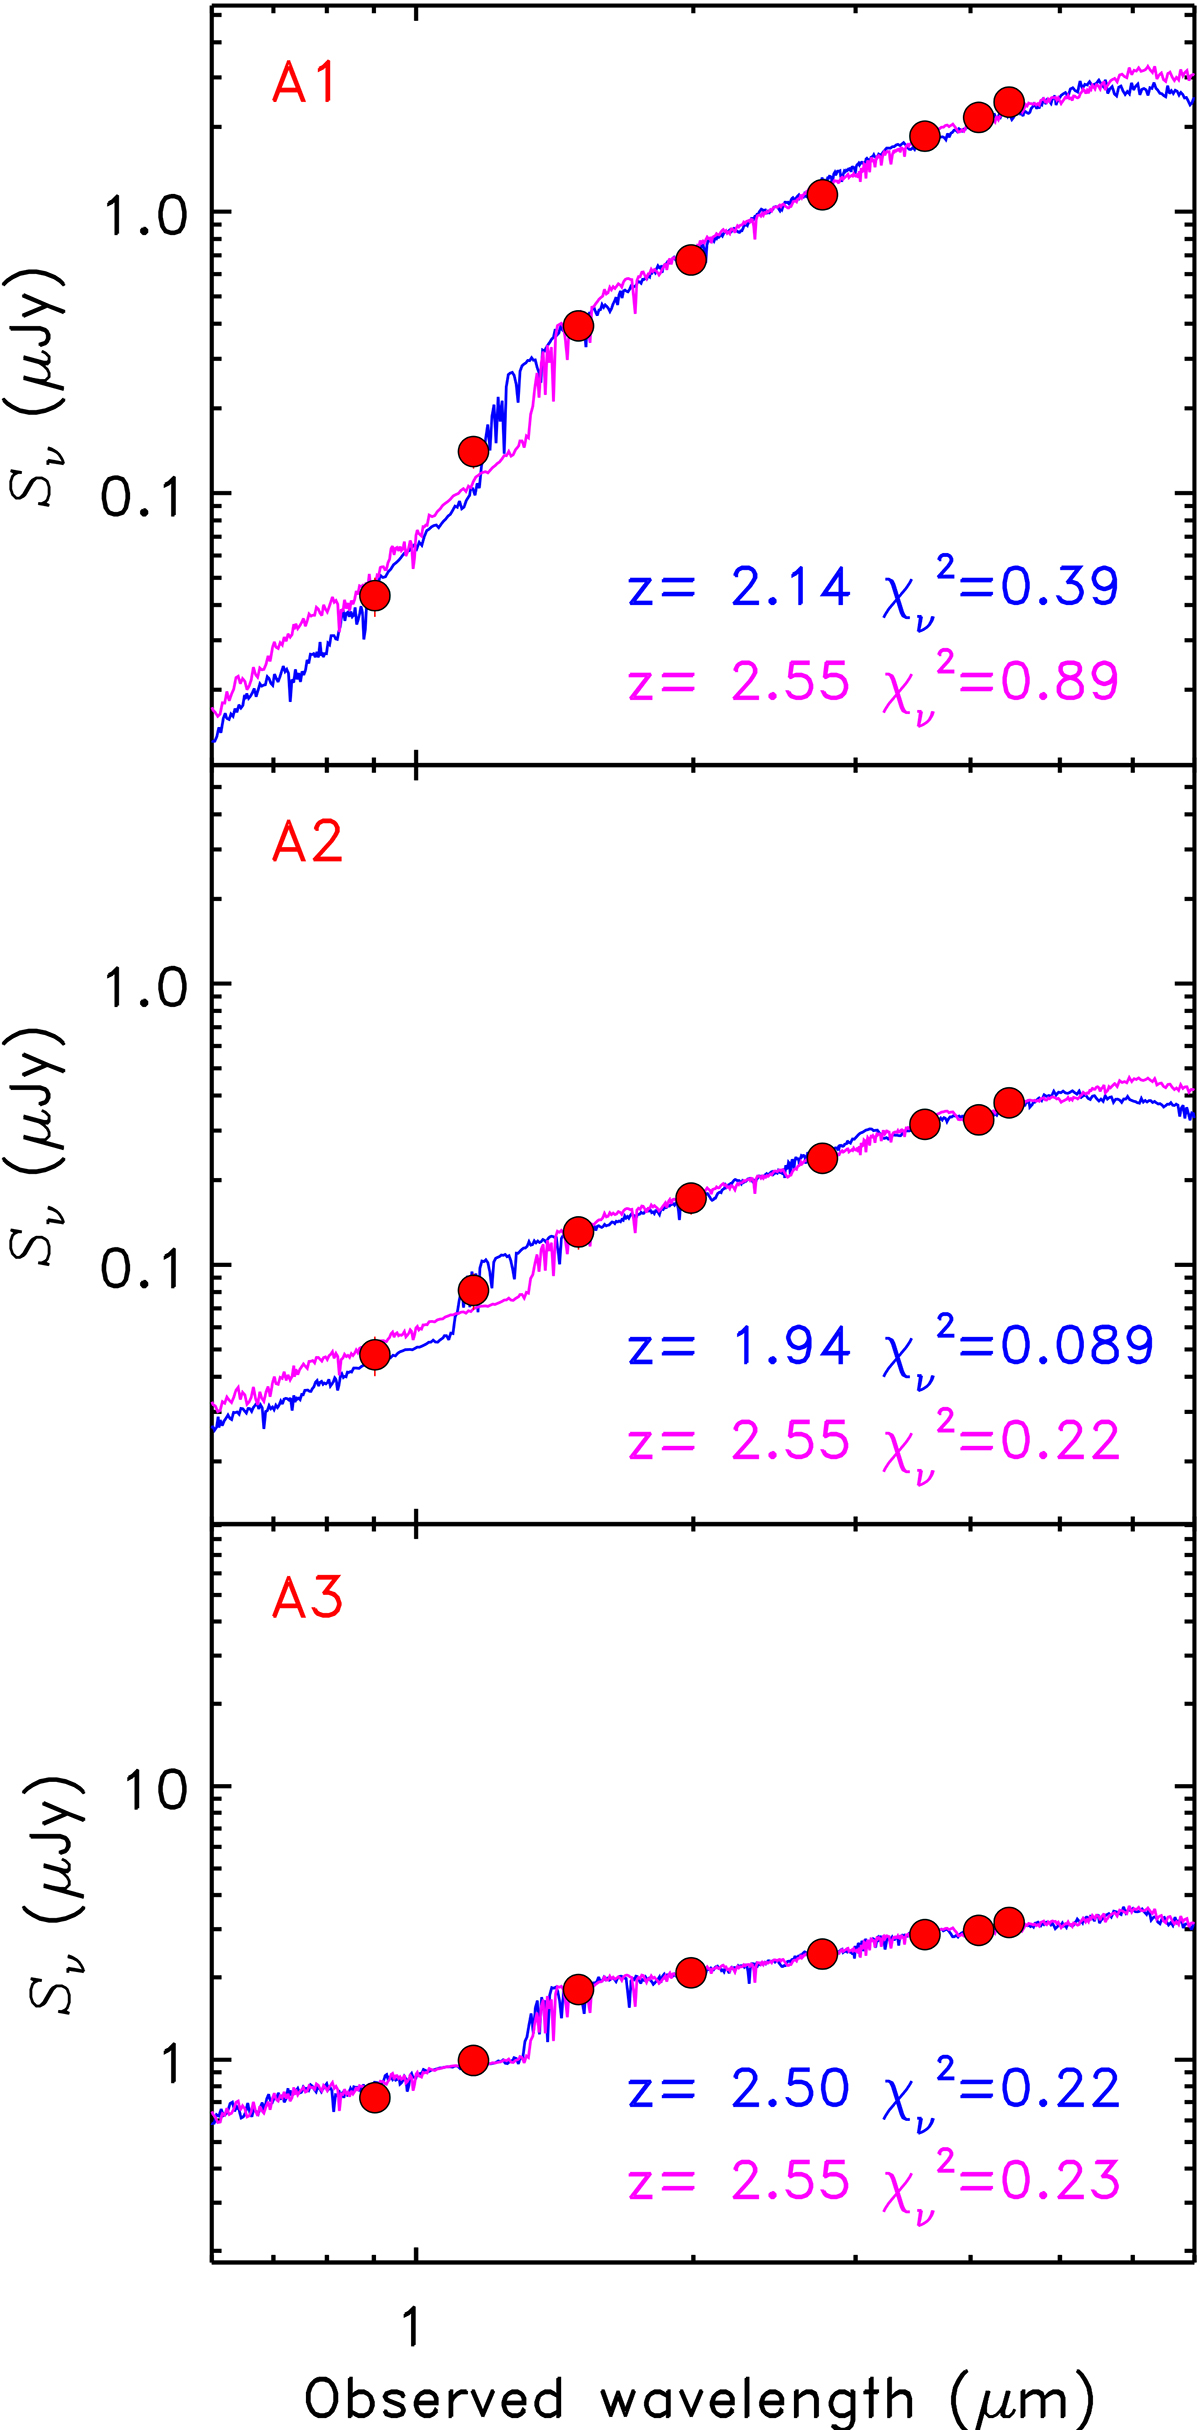
SED of the sources within 1.5″ of source 01a and considered distinct sources (filled red circles; A1 in the top panel, A2 in the middle panel, and A3 in the bottom panel). In each panel, the best fit model, associated photometric redshift, and reduced-χ2 are shown in blue, and the model at the same redshift of 01a and corresponding reduced-χ2 are shown in magenta.
Current usage metrics show cumulative count of Article Views (full-text article views including HTML views, PDF and ePub downloads, according to the available data) and Abstracts Views on Vision4Press platform.
Data correspond to usage on the plateform after 2015. The current usage metrics is available 48-96 hours after online publication and is updated daily on week days.
Initial download of the metrics may take a while.