Fig. 15.
Download original image
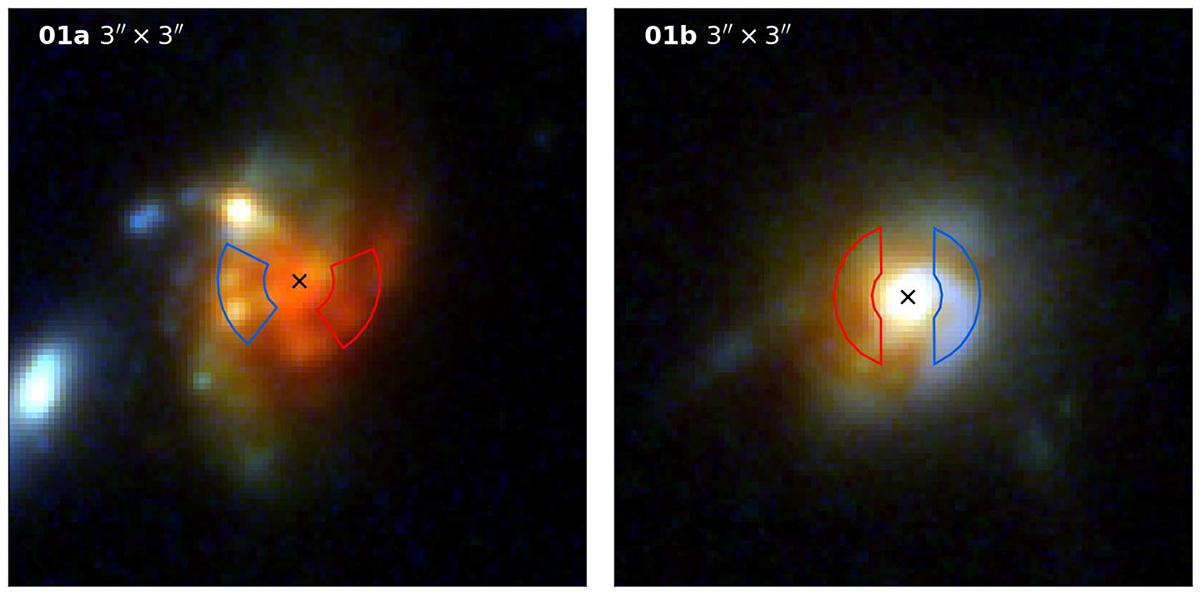
Multicolor 3″ × 3″ (corresponding to 25 pkpc × 25 pkpc) JWST/NIRCam images of 01a (left) and 01b (right). Colors are as in Fig. 3. The areas used to compute the dust-attenuation curve are outlined in blue for the less attenuated regions and in red for the more attenuated. In 01a, the ring has minimum radius of 0![]() 18 and maximum of 0
18 and maximum of 0![]() 42, and in 01b, it has minimum radius of 0
42, and in 01b, it has minimum radius of 0![]() 18 and maximum of 0
18 and maximum of 0![]() 38. The center of each galaxy is indicated by a black cross. North is up and east to the left.
38. The center of each galaxy is indicated by a black cross. North is up and east to the left.
Current usage metrics show cumulative count of Article Views (full-text article views including HTML views, PDF and ePub downloads, according to the available data) and Abstracts Views on Vision4Press platform.
Data correspond to usage on the plateform after 2015. The current usage metrics is available 48-96 hours after online publication and is updated daily on week days.
Initial download of the metrics may take a while.