Open Access
Fig. 14.
Download original image
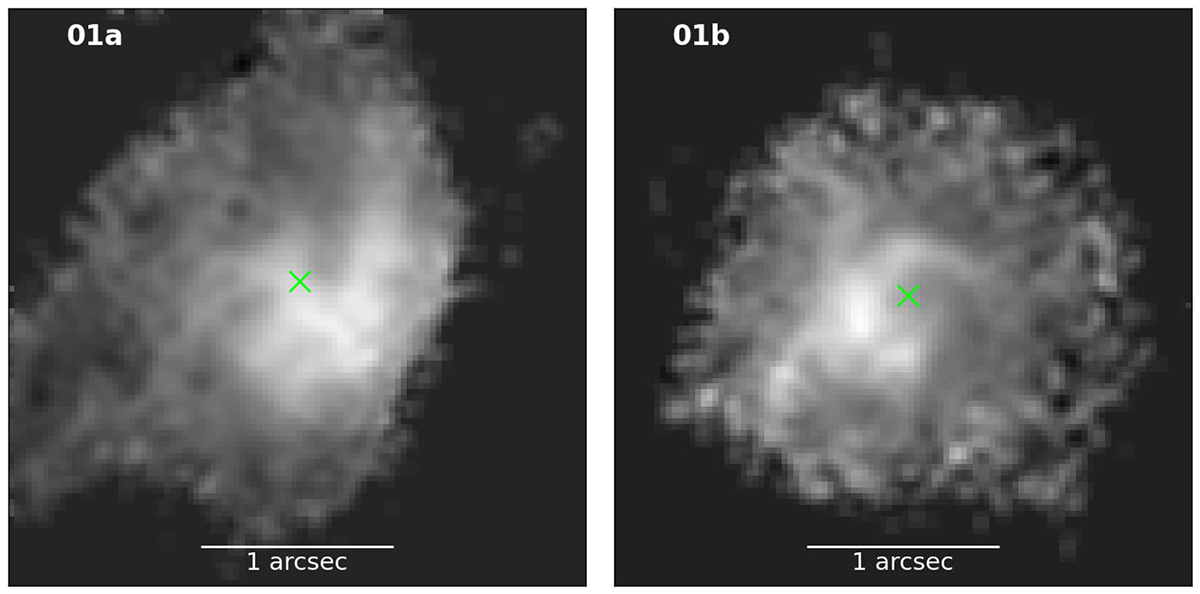
3″ ×3 ″ pseudo-extinction images of 01a (left) and 01b (right). Lighter areas correspond to higher extinction, which was derived as −2.5 × log(SF277W/SF444W) and only for pixels with > 3σ detections in both bands. The green crosses mark the galaxy centers.
Current usage metrics show cumulative count of Article Views (full-text article views including HTML views, PDF and ePub downloads, according to the available data) and Abstracts Views on Vision4Press platform.
Data correspond to usage on the plateform after 2015. The current usage metrics is available 48-96 hours after online publication and is updated daily on week days.
Initial download of the metrics may take a while.