Open Access
Fig. B.1
Download original image
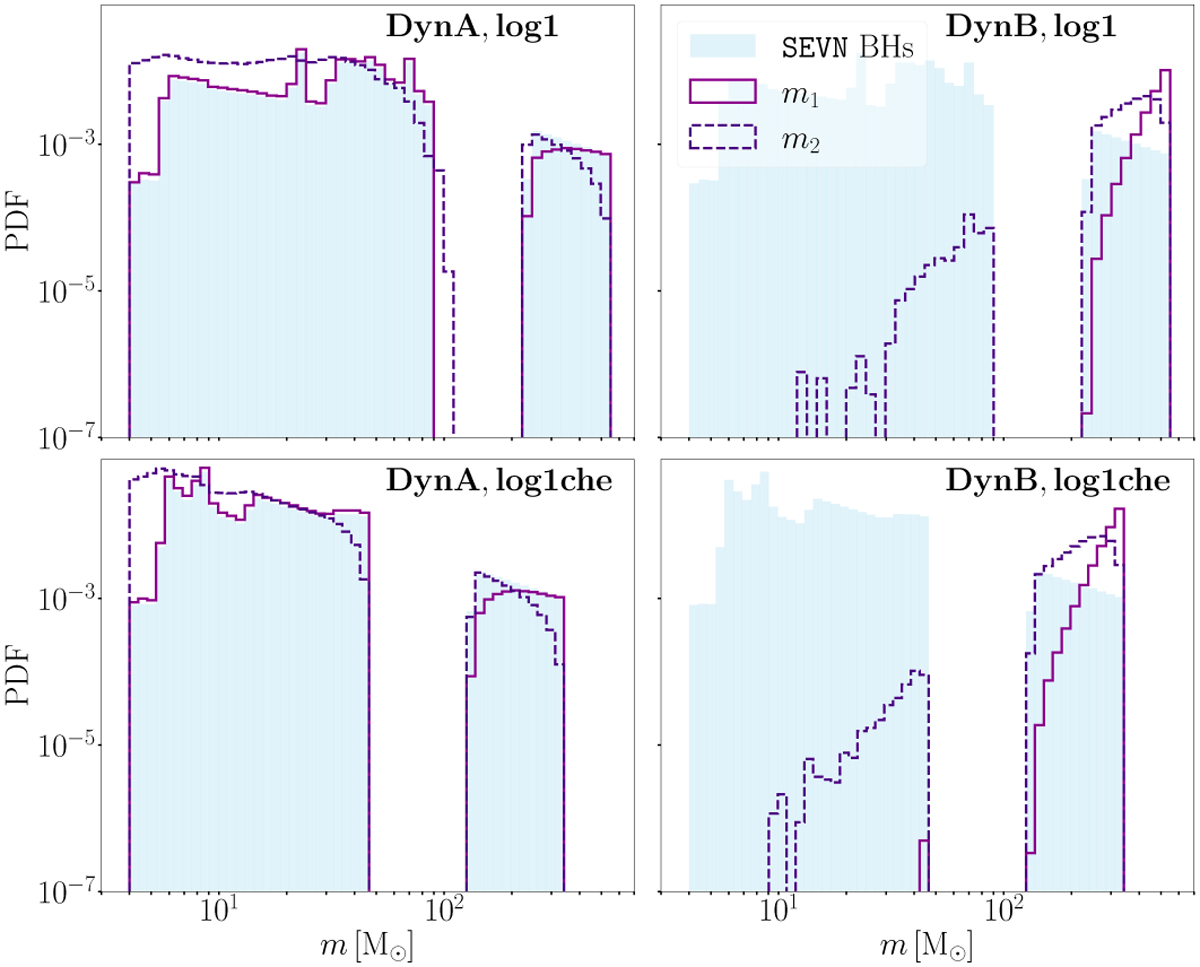
Distribution of m1 (purple solid line) and m2 (violet dashed line) for first-generation BBHs, for model DynA (left) and DynB (right). The blue shaded area represents the distribution of single BHs from the SEVN catalog. We show the log1 (upper panel) and log1che (lower panel) models.
Current usage metrics show cumulative count of Article Views (full-text article views including HTML views, PDF and ePub downloads, according to the available data) and Abstracts Views on Vision4Press platform.
Data correspond to usage on the plateform after 2015. The current usage metrics is available 48-96 hours after online publication and is updated daily on week days.
Initial download of the metrics may take a while.