Fig. 4.
Download original image
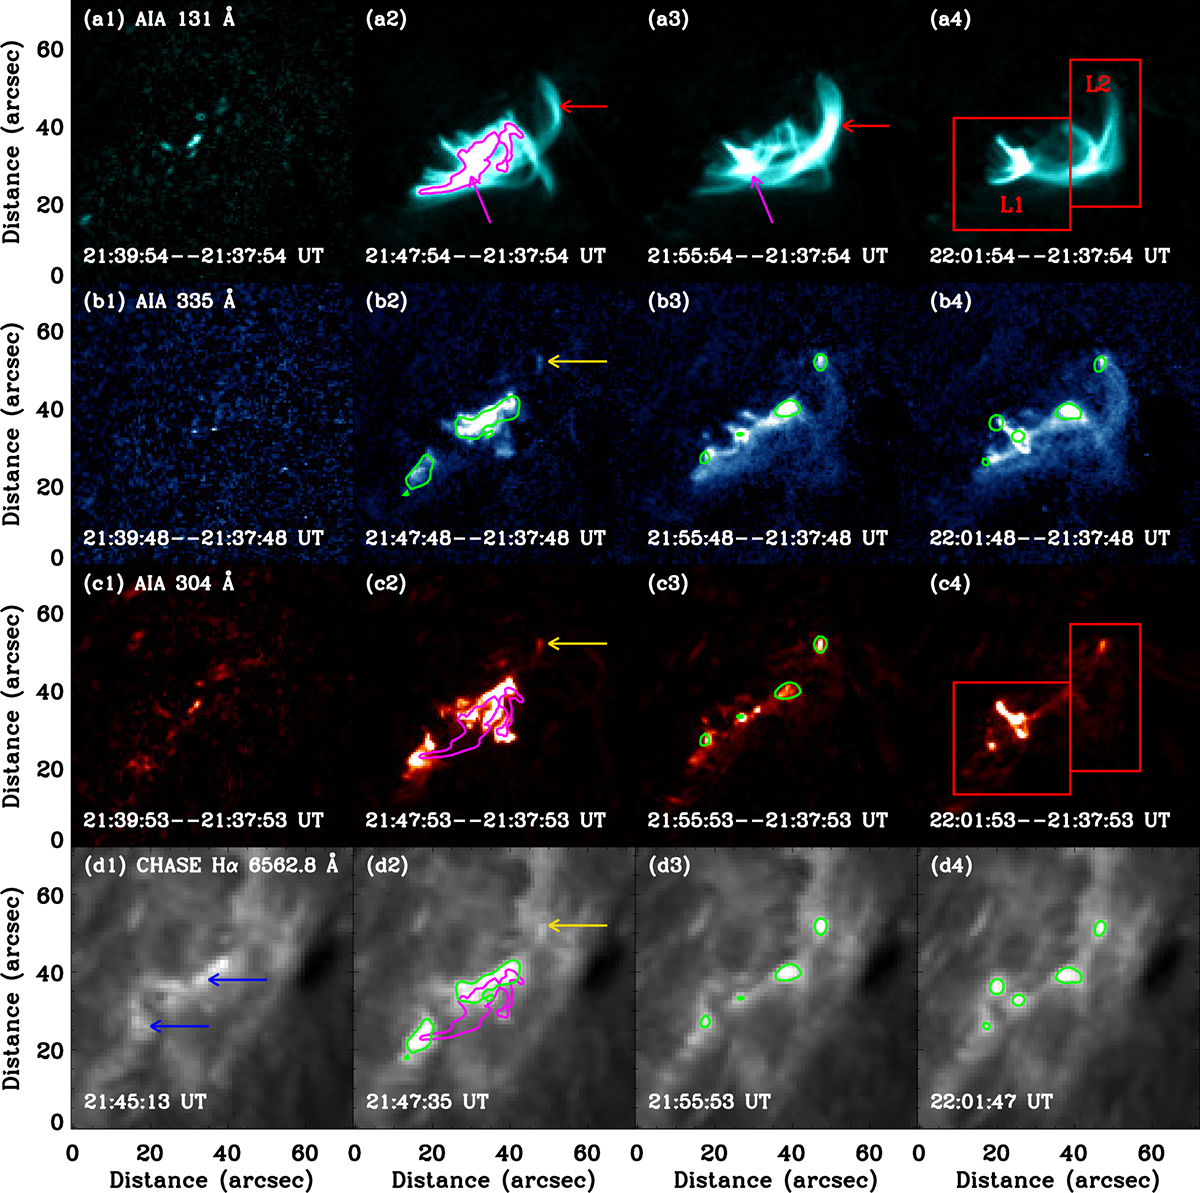
Multiwavelength images with a FOV of ∼72″ × 72″ during the C2.8 flare. Panels a1–c4: Base different images measured by SDO/AIA at 131 Å, 335 Å, and 304 Å. Panels d1–d4: Hα images observed by CHASE. The magenta contour represents the hot plasma emission from AIA 131 Å, while the green contours are the plasma radiation from Hα. The magenta an red arrows mark the flare loops, while the blue and gold arrows outline the flare kernels. The red rectangles contain two hot loop systems (L1 and L2) at AIA 131 Å.
Current usage metrics show cumulative count of Article Views (full-text article views including HTML views, PDF and ePub downloads, according to the available data) and Abstracts Views on Vision4Press platform.
Data correspond to usage on the plateform after 2015. The current usage metrics is available 48-96 hours after online publication and is updated daily on week days.
Initial download of the metrics may take a while.