Fig. 2.
Download original image
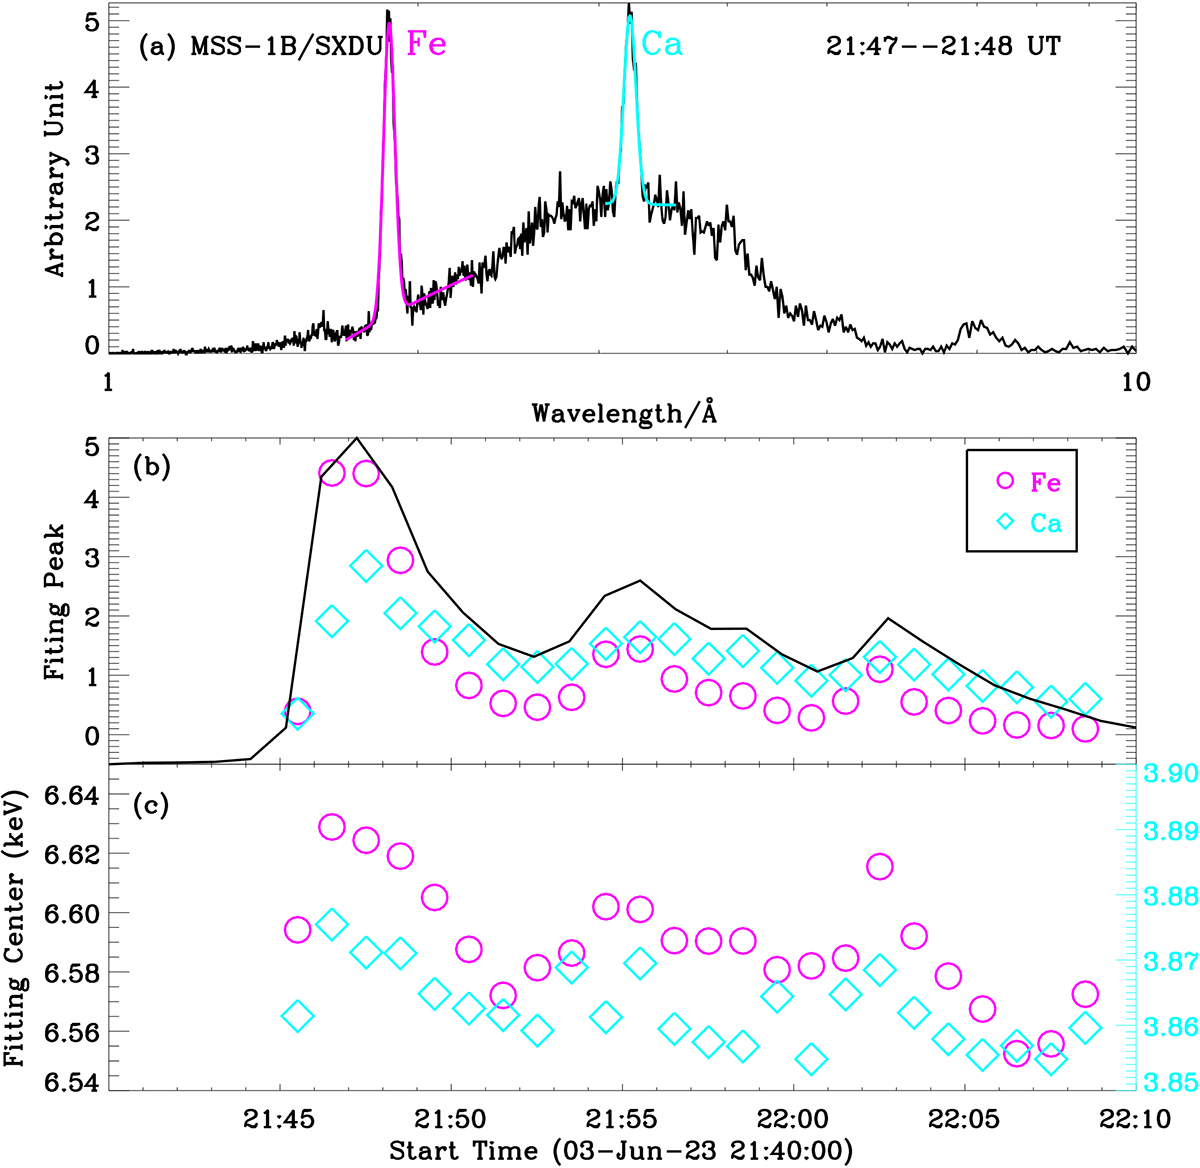
Observational results measured from MSS-1B/SXDU. Panel a: SXR spectrum integrated over one minute during the C2.8 flare in the range 1−10 Å. The magenta and cyan curves represent the Gaussian fitting results for the Fe and Ca lines, respectively. Panels b and c: Time series of the fitting peak and center for Fe (circular) and Ca (diamond) lines.
Current usage metrics show cumulative count of Article Views (full-text article views including HTML views, PDF and ePub downloads, according to the available data) and Abstracts Views on Vision4Press platform.
Data correspond to usage on the plateform after 2015. The current usage metrics is available 48-96 hours after online publication and is updated daily on week days.
Initial download of the metrics may take a while.