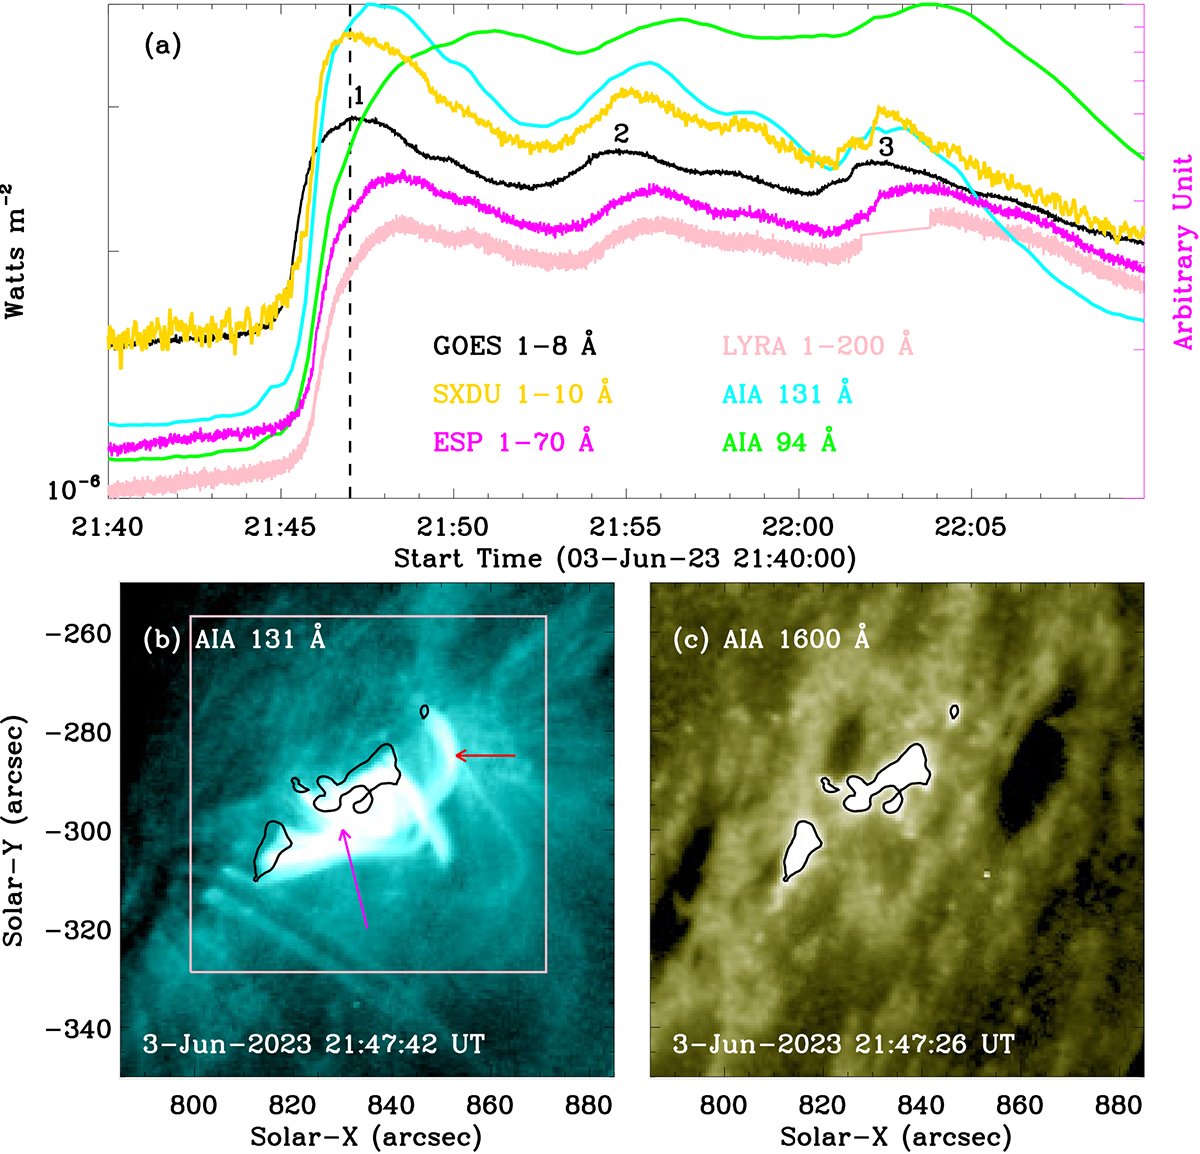
Fig. 1.
Download original image
Overview of the C2.8 flare on 2023 June 3. Panel a: Full-disk light curves recorded by GOES 1−8 Å (black), SXDU 1−10 Å (gold), ESP 1−70 Å (magenta), and LYRA 1−200 Å (pink), as well as the local fluxes measured by SDO/AIA at 131 Å (cyan) and 94 Å (green). The vertical line marks the flare peak time. Panels b and c: EUV/UV snapshots with a FOV of ∼100″ × 100″ in wavelengths of AIA 131 Å and 1600 Å. The black contours outline flare ribbons in AIA 1600 Å. The colored arrows indicate hot loop systems. The pink box marks the flare region (∼72″ × 72″) used to integrate the local flux. A movie associated to this figure is available online.
Current usage metrics show cumulative count of Article Views (full-text article views including HTML views, PDF and ePub downloads, according to the available data) and Abstracts Views on Vision4Press platform.
Data correspond to usage on the plateform after 2015. The current usage metrics is available 48-96 hours after online publication and is updated daily on week days.
Initial download of the metrics may take a while.