Fig. 8
Download original image
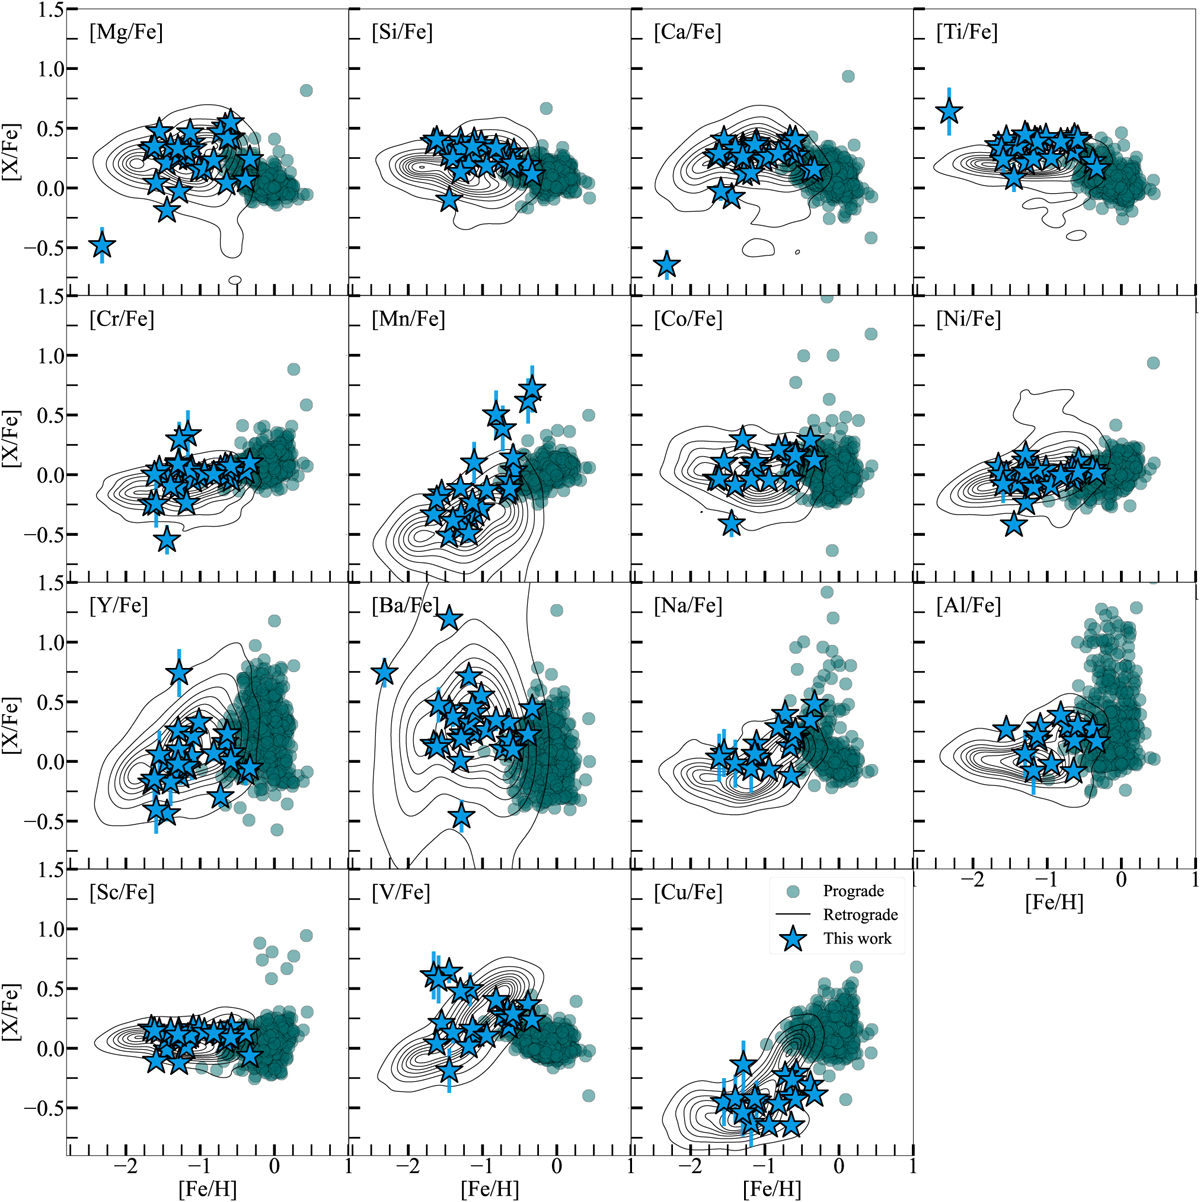
Chemical abundance distribution as a function of [Fe/H], Stars in blue are those studied in this work. The chemical abundances are those obtained using the spectroscopic log ɡ. The teal dots (prograde stars from Mackereth et al. 2021) and black contours (GALAH DR3 retrograde metal-poor stars) are the same control sample stars adopted in Fig. 5. The chemical elements are ordered according to their main nucleosynthetic channel: α-capture, iron peak, neutron-capture, and odd-Z. Within each nucleosynthetic channel, the chemical elements are organized according to atomic number.
Current usage metrics show cumulative count of Article Views (full-text article views including HTML views, PDF and ePub downloads, according to the available data) and Abstracts Views on Vision4Press platform.
Data correspond to usage on the plateform after 2015. The current usage metrics is available 48-96 hours after online publication and is updated daily on week days.
Initial download of the metrics may take a while.