Fig. 6
Download original image
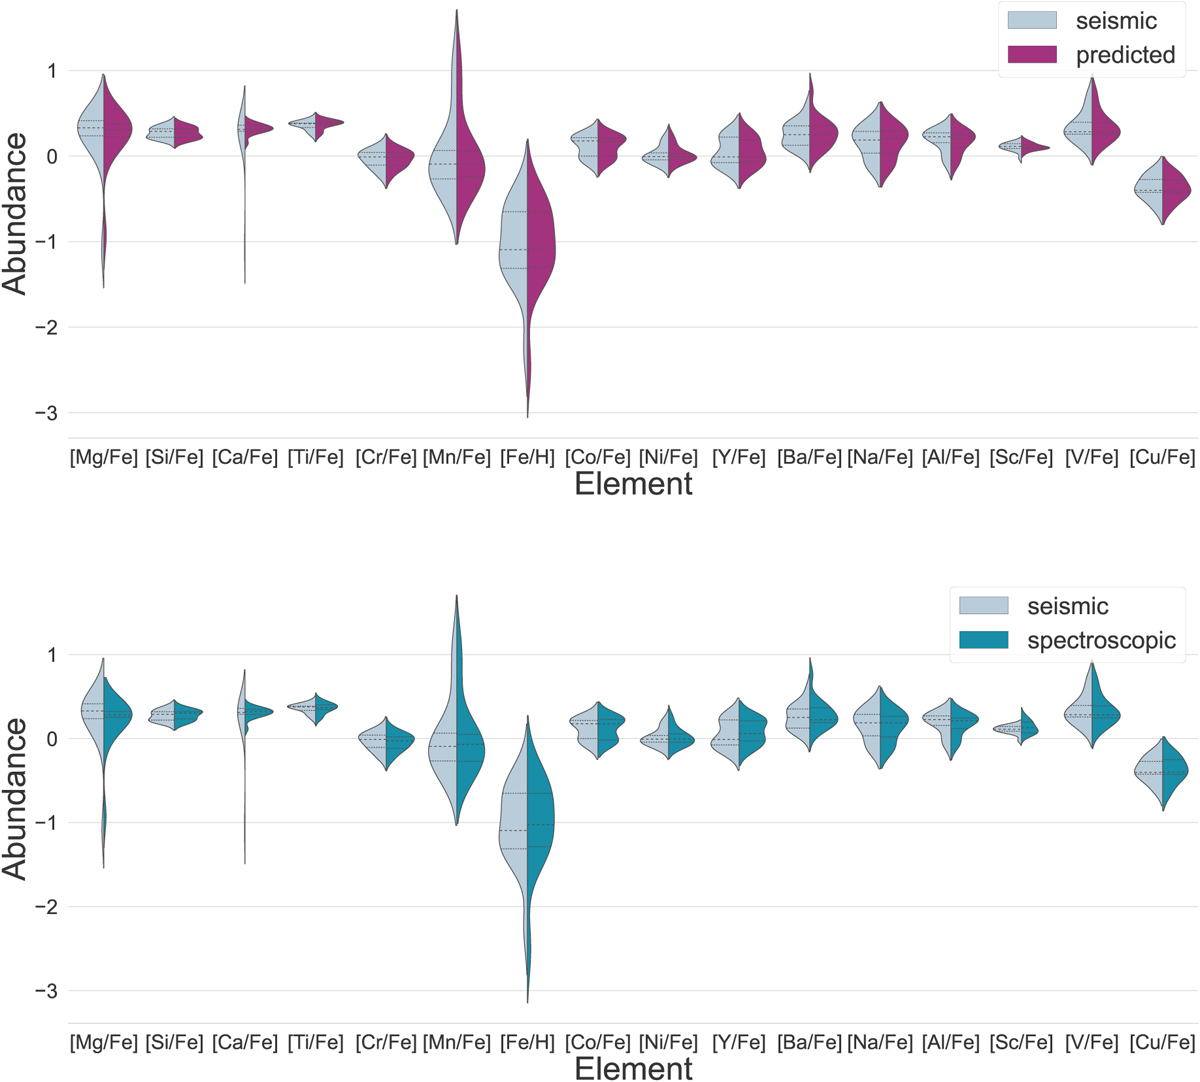
Comparison of chemical abundance distribution obtained adopting the different log ɡ. The top panel shows the chemical distribution per element when using the seismic log ɡ (gray) and the predicted log ɡ (magenta). The bottom panel shows the chemical distribution per element when adopting the seismic log ɡ (gray) and the spectroscopic log ɡ (blue). The central dashed line represents the median of the distributions, while the other lines neighboring it show the data quartiles. The chemical abundances are ordered according to main nucleosynthetic channel: α-capture, iron peak, neutron-capture, and odd-Z. Within each nucleosynthetic channel, the chemical elements are organized according to atomic number.
Current usage metrics show cumulative count of Article Views (full-text article views including HTML views, PDF and ePub downloads, according to the available data) and Abstracts Views on Vision4Press platform.
Data correspond to usage on the plateform after 2015. The current usage metrics is available 48-96 hours after online publication and is updated daily on week days.
Initial download of the metrics may take a while.