Fig. 3
Download original image
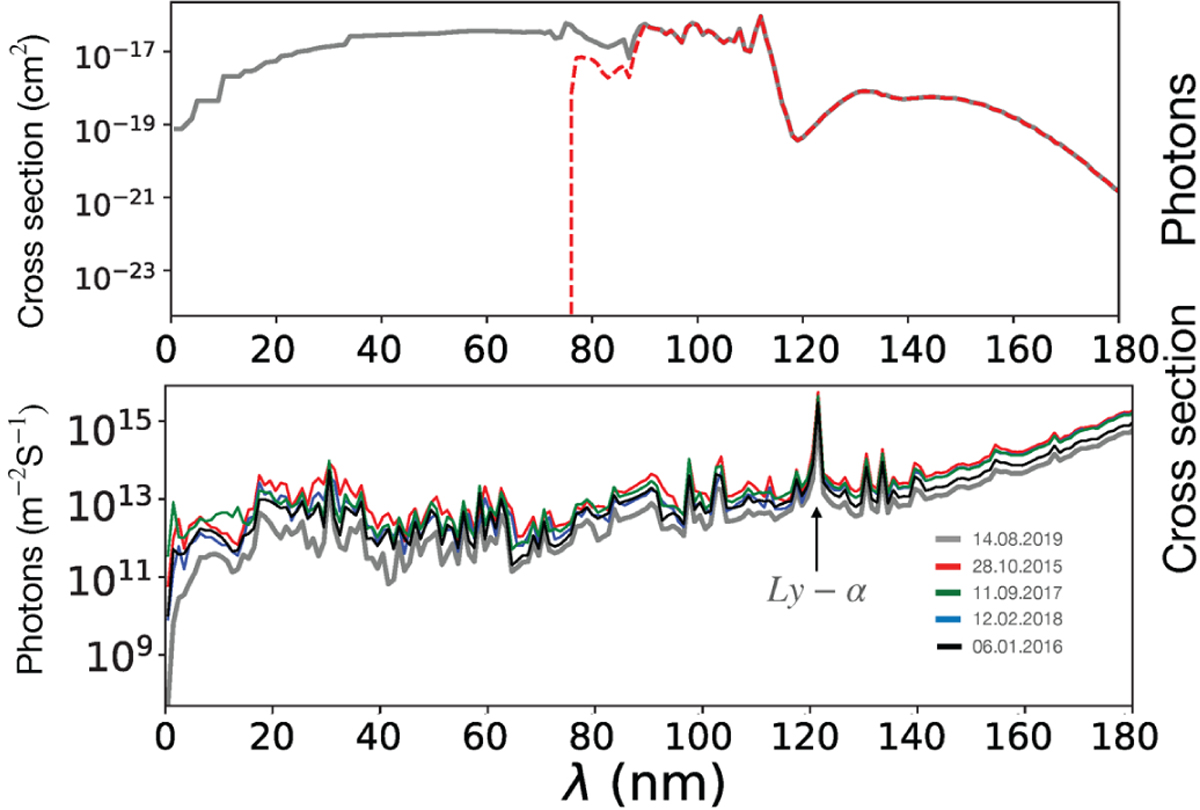
Solar input spectra. Top: photo-absorption cross section of CO2 at 250 K as the gray line. Overplotted as the dashed red line is the photodissociation cross section. For shorter wavelengths of the spectrum, the photoionizing energies have a threshold ≈80 nm. Bottom: Typical solar EUV/UV spectrum at 1 nm resolution, as observed by the MAVEN/EUM spectrograph, scaled at 1 AU, at different dates of the solar cycle.
Current usage metrics show cumulative count of Article Views (full-text article views including HTML views, PDF and ePub downloads, according to the available data) and Abstracts Views on Vision4Press platform.
Data correspond to usage on the plateform after 2015. The current usage metrics is available 48-96 hours after online publication and is updated daily on week days.
Initial download of the metrics may take a while.