Open Access
Fig. 2
Download original image
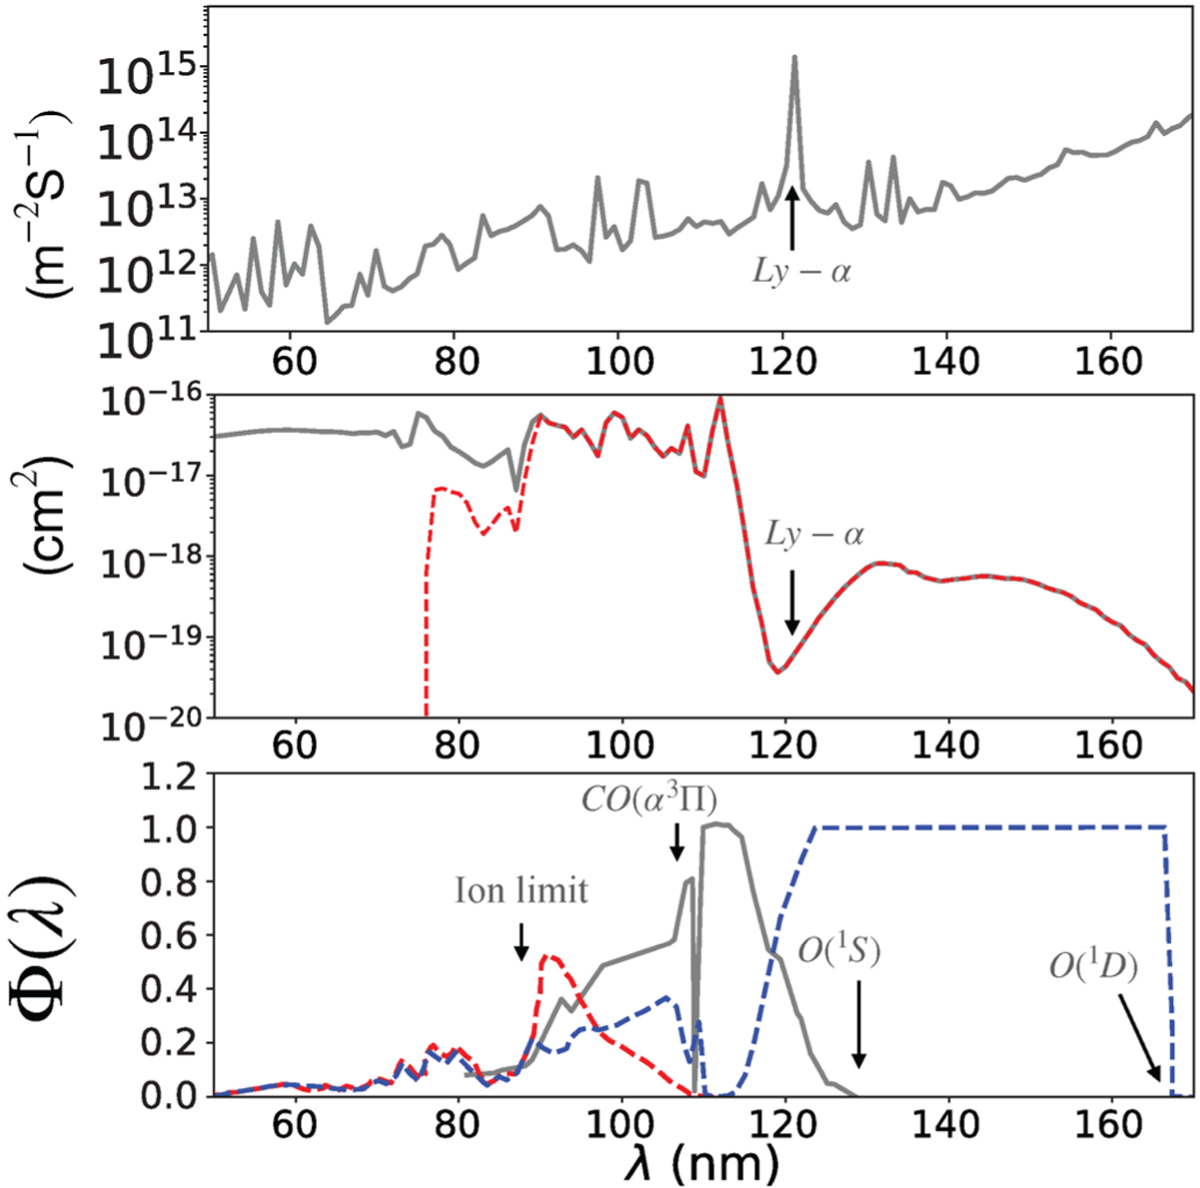
Range of spectral interest. Top and middle: same as Fig. 3, but zoomed in the Φ(λ) spectral region. Bottom: Φ(λ) as adopted by Huestis et al. (2010) based on all laboratory measurements that are shown in Fig. 1. The uncertainties of the proposed values are shown in Fig. 7.
Current usage metrics show cumulative count of Article Views (full-text article views including HTML views, PDF and ePub downloads, according to the available data) and Abstracts Views on Vision4Press platform.
Data correspond to usage on the plateform after 2015. The current usage metrics is available 48-96 hours after online publication and is updated daily on week days.
Initial download of the metrics may take a while.