Fig. B.2
Download original image
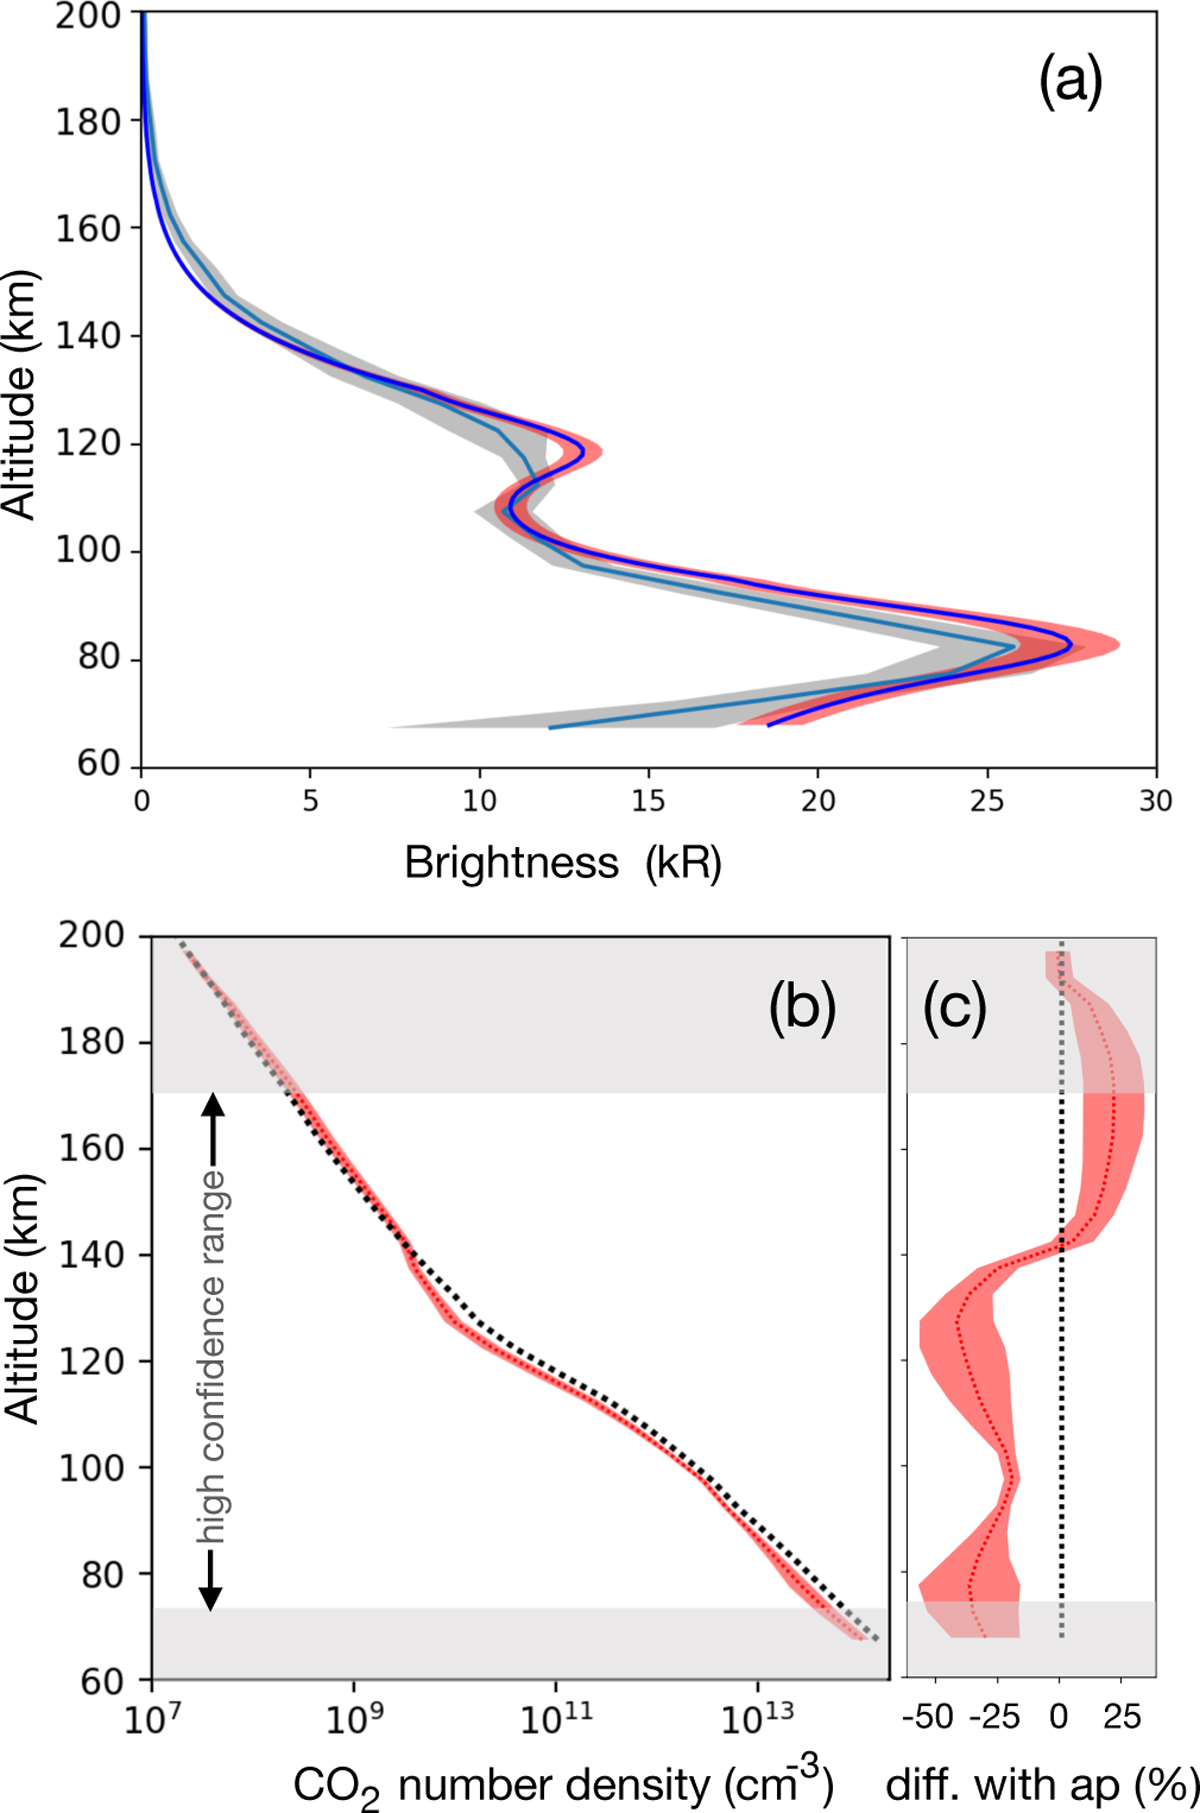
Demonstration of the algorithm in a case study profile from IUVS observations is shown as the light blue line and the data uncertainty is the grey shading, in panel (a) together with the forward model simulation using the a priori CO2 vertical density together with the total model uncertainty in shaded red. (b) The CO2 number densities: the black dashed line represents the a priori, the dashed red the final vertical distribution of CO2 number density where the fit satisfies the algorithm and Φ(λ) can be retrieved. The shaded red region is the total uncertainty, (c) The difference in percentage of the final vertical profile with the a priori and the total uncertainty, same as (b).
Current usage metrics show cumulative count of Article Views (full-text article views including HTML views, PDF and ePub downloads, according to the available data) and Abstracts Views on Vision4Press platform.
Data correspond to usage on the plateform after 2015. The current usage metrics is available 48-96 hours after online publication and is updated daily on week days.
Initial download of the metrics may take a while.