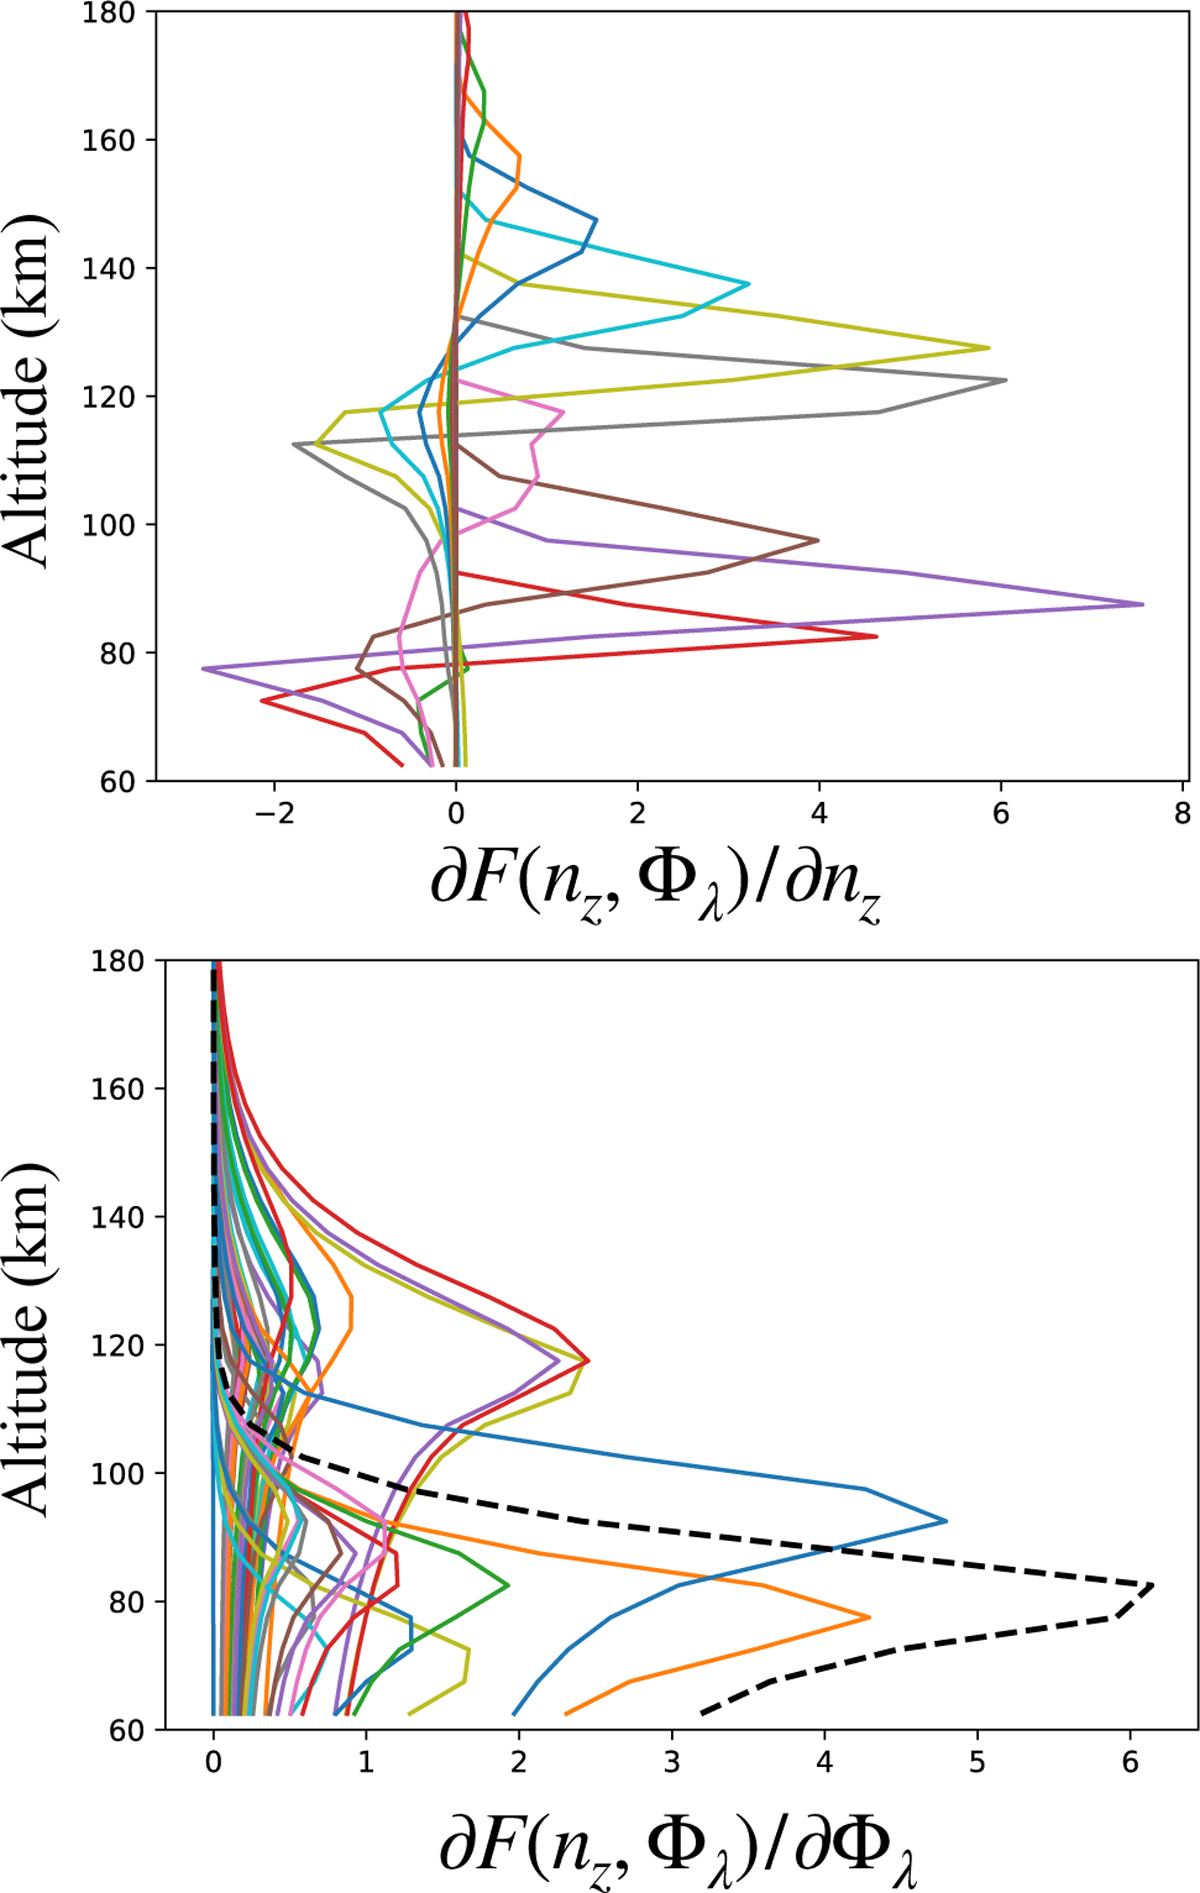
Fig. B.1
Download original image
Typical Jacobian kernels. Top: Sensitivity of the forward model in the vertical distribution of CO2 number density. The different colours correspond to each altitude bin that is defined by the observational measurements. Bottom: Sensitivity of the quantum yield to the corresponding altitude grid. Different colours correspond to different wavelengths with lnm resolution from 80 to 128nm. With dashed black line we show the Ly – α line divided by a factor of 10. It is not surprising that Ly – α shows this sensitivity, since the production of the lower peak is almost solely produced by it.
Current usage metrics show cumulative count of Article Views (full-text article views including HTML views, PDF and ePub downloads, according to the available data) and Abstracts Views on Vision4Press platform.
Data correspond to usage on the plateform after 2015. The current usage metrics is available 48-96 hours after online publication and is updated daily on week days.
Initial download of the metrics may take a while.