Open Access
Fig. 4.
Download original image
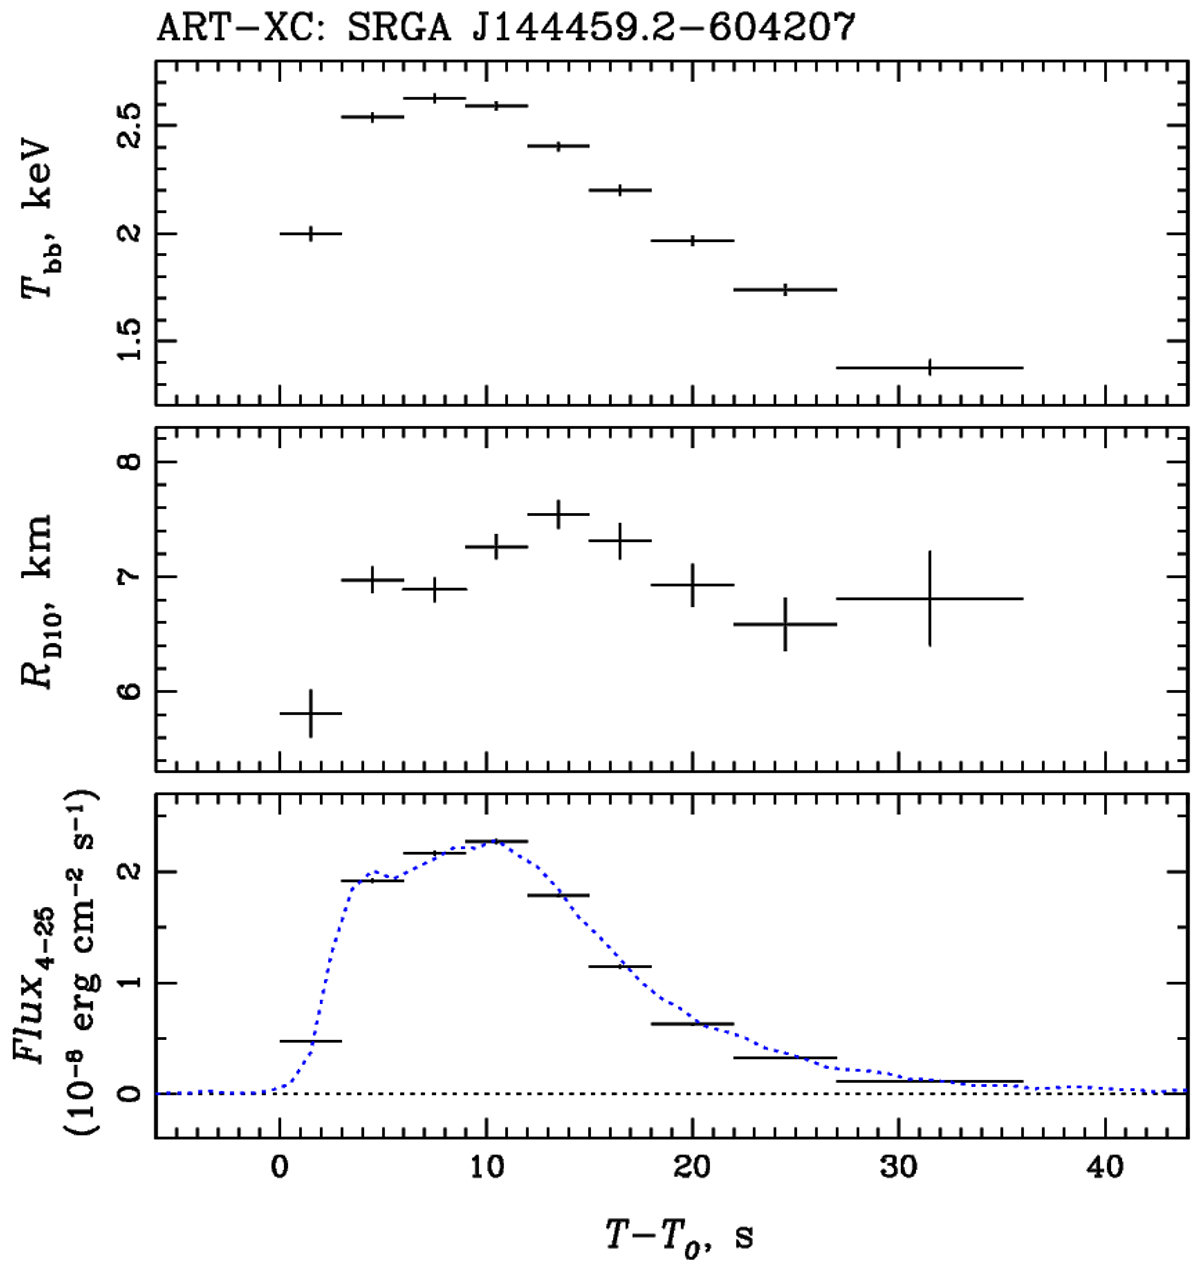
Time-resolved spectroscopy of the averaged X-ray burst emission. The dotted blue line in the bottom panel shows the rescaled in amplitude count-rate light curve in 4–25 keV to match the measured fluxes. The pre-burst rate is subtracted.
Current usage metrics show cumulative count of Article Views (full-text article views including HTML views, PDF and ePub downloads, according to the available data) and Abstracts Views on Vision4Press platform.
Data correspond to usage on the plateform after 2015. The current usage metrics is available 48-96 hours after online publication and is updated daily on week days.
Initial download of the metrics may take a while.