Open Access
Fig. 13.
Download original image
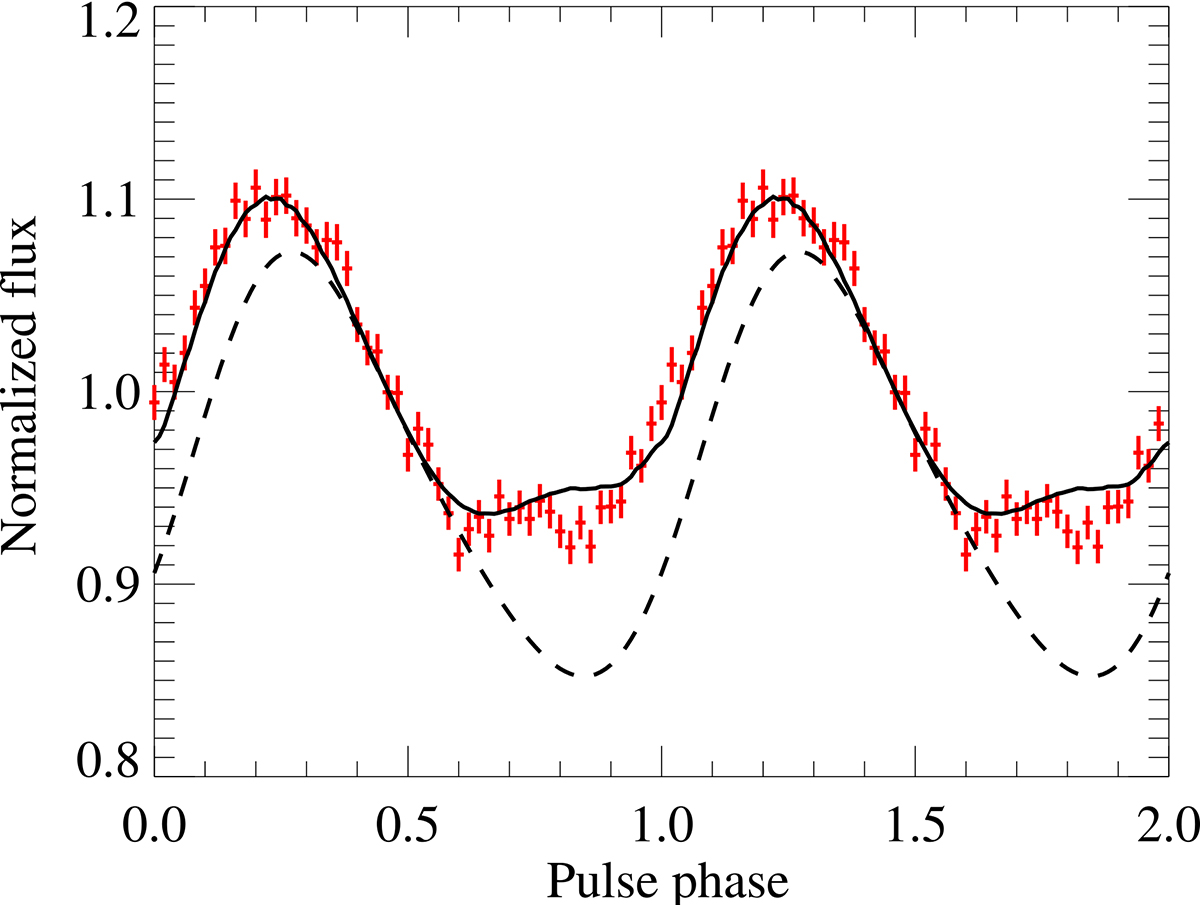
Normalized pulse profiles of the persistent emission of SRGA J1444 during the high state (upper data point at Fig. 7b shown with red crosses) together with an example two-spot model (solid black curve). The dashed curve gives the contribution from the primary spot.
Current usage metrics show cumulative count of Article Views (full-text article views including HTML views, PDF and ePub downloads, according to the available data) and Abstracts Views on Vision4Press platform.
Data correspond to usage on the plateform after 2015. The current usage metrics is available 48-96 hours after online publication and is updated daily on week days.
Initial download of the metrics may take a while.