Open Access
Fig. 11.
Download original image
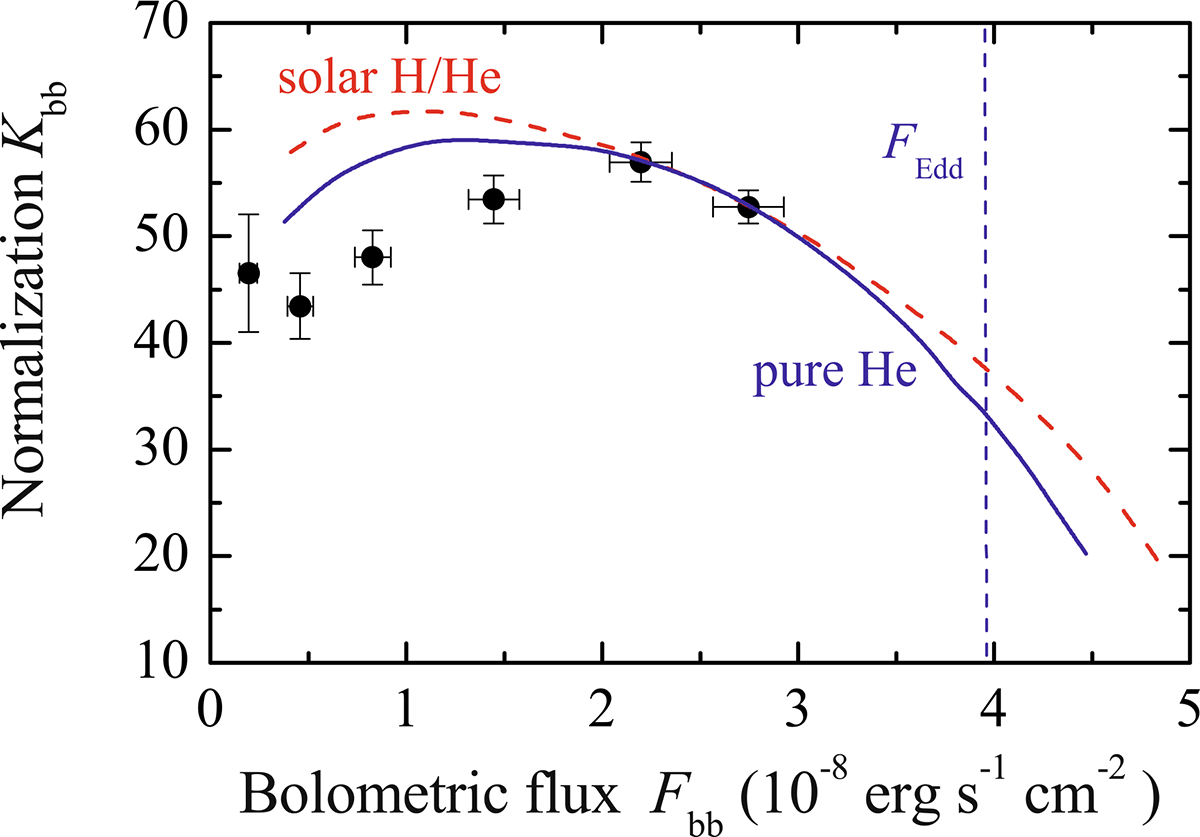
Evolution of the spectral parameters of the averaged X-ray burst from SRGA J1444. The best-fit model curves for solar H/He mix (dashed red curve) and pure He atmospheres (solid blue curve) are shown. The vertical dashed line corresponds to the Eddington flux for a pure He atmosphere model.
Current usage metrics show cumulative count of Article Views (full-text article views including HTML views, PDF and ePub downloads, according to the available data) and Abstracts Views on Vision4Press platform.
Data correspond to usage on the plateform after 2015. The current usage metrics is available 48-96 hours after online publication and is updated daily on week days.
Initial download of the metrics may take a while.