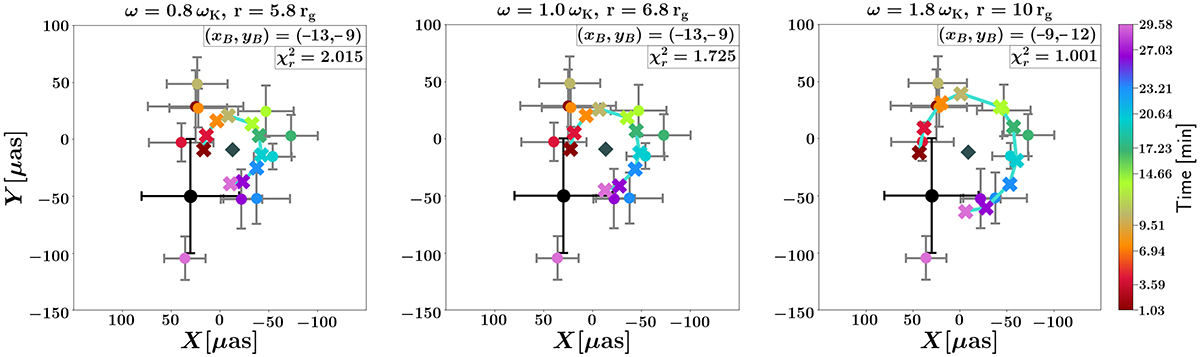
Fig. 1.
Download original image
Circular hot spot trajectories on the equatorial plane of a Schwarzschild black hole overlapped with the observed flare of July 22, 2018. Calculated flux-centroid positions (colorful ‘x’) are color-coordinated with the observations (colorful circles) and the associated timestamps are denoted in the far-right color bar. The approximate position of SgrA* in the sky, derived from observations, is depicted by a black circle. The black hole position for each orbit is illustrated by a dark gray diamond and denoted in the top right legend, along with the associated value of χr2. The observer angle is face-on and the orbital frequency of the hot spot corresponds to Left Panel: Sub-Keplerian motion (0.8 ωK), Middle Panel: Keplerian motion (ωK), and Right Panel: Super-Keplerian motion (1.8 ωK), respectively.
Current usage metrics show cumulative count of Article Views (full-text article views including HTML views, PDF and ePub downloads, according to the available data) and Abstracts Views on Vision4Press platform.
Data correspond to usage on the plateform after 2015. The current usage metrics is available 48-96 hours after online publication and is updated daily on week days.
Initial download of the metrics may take a while.