Fig. 5.
Download original image
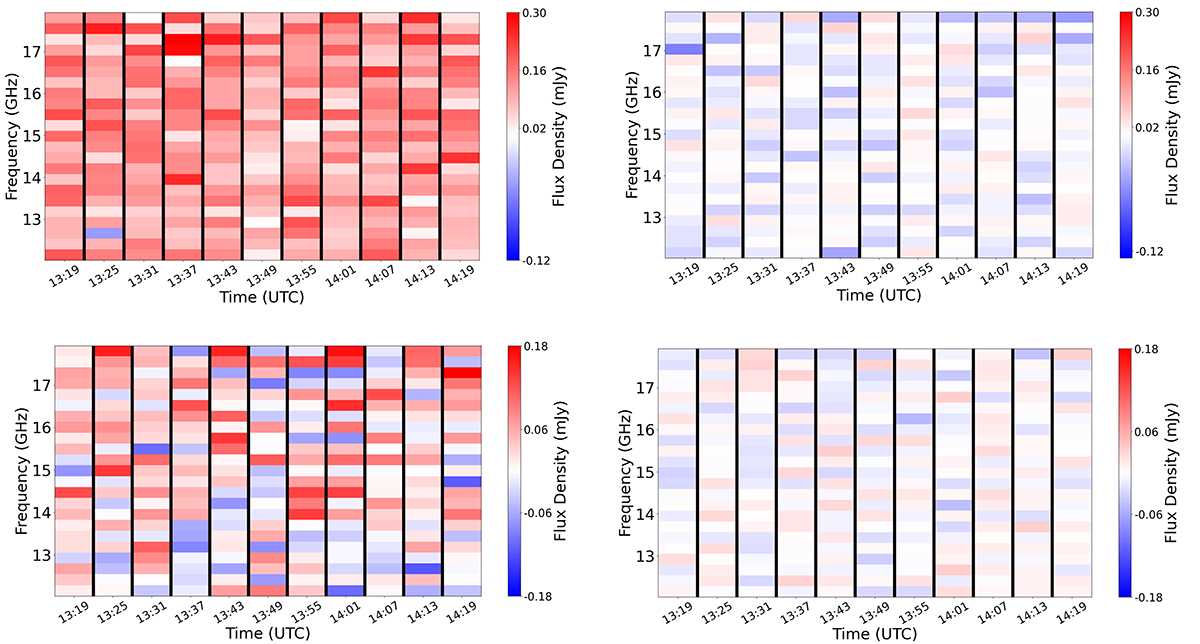
Dynamic spectrum of a region encompassing the source (left) and another region away from the phase center for the March 26th observation, in Stokes I (top) and Stokes V (bottom). The dynamic spectrum has been obtained selecting the source from the image plane and integrating over 256 MHz-wide spectral windows, for each scan (approximately 6 min long). On average, the rms in each pixel is ∼70 μJy beam−1 for each scan in both Stokes I and Stokes V. The thin vertical black lines between target scans represent the time spent on the phase calibrator (∼48 s). The panels on the right side have been plotted only to present a visual comparison between the flux values during the presence and absence of a radio source. To obtain these spectra, we used the CASA task specflux and imstat after generating the cube images with tclean, for every source scan.
Current usage metrics show cumulative count of Article Views (full-text article views including HTML views, PDF and ePub downloads, according to the available data) and Abstracts Views on Vision4Press platform.
Data correspond to usage on the plateform after 2015. The current usage metrics is available 48-96 hours after online publication and is updated daily on week days.
Initial download of the metrics may take a while.