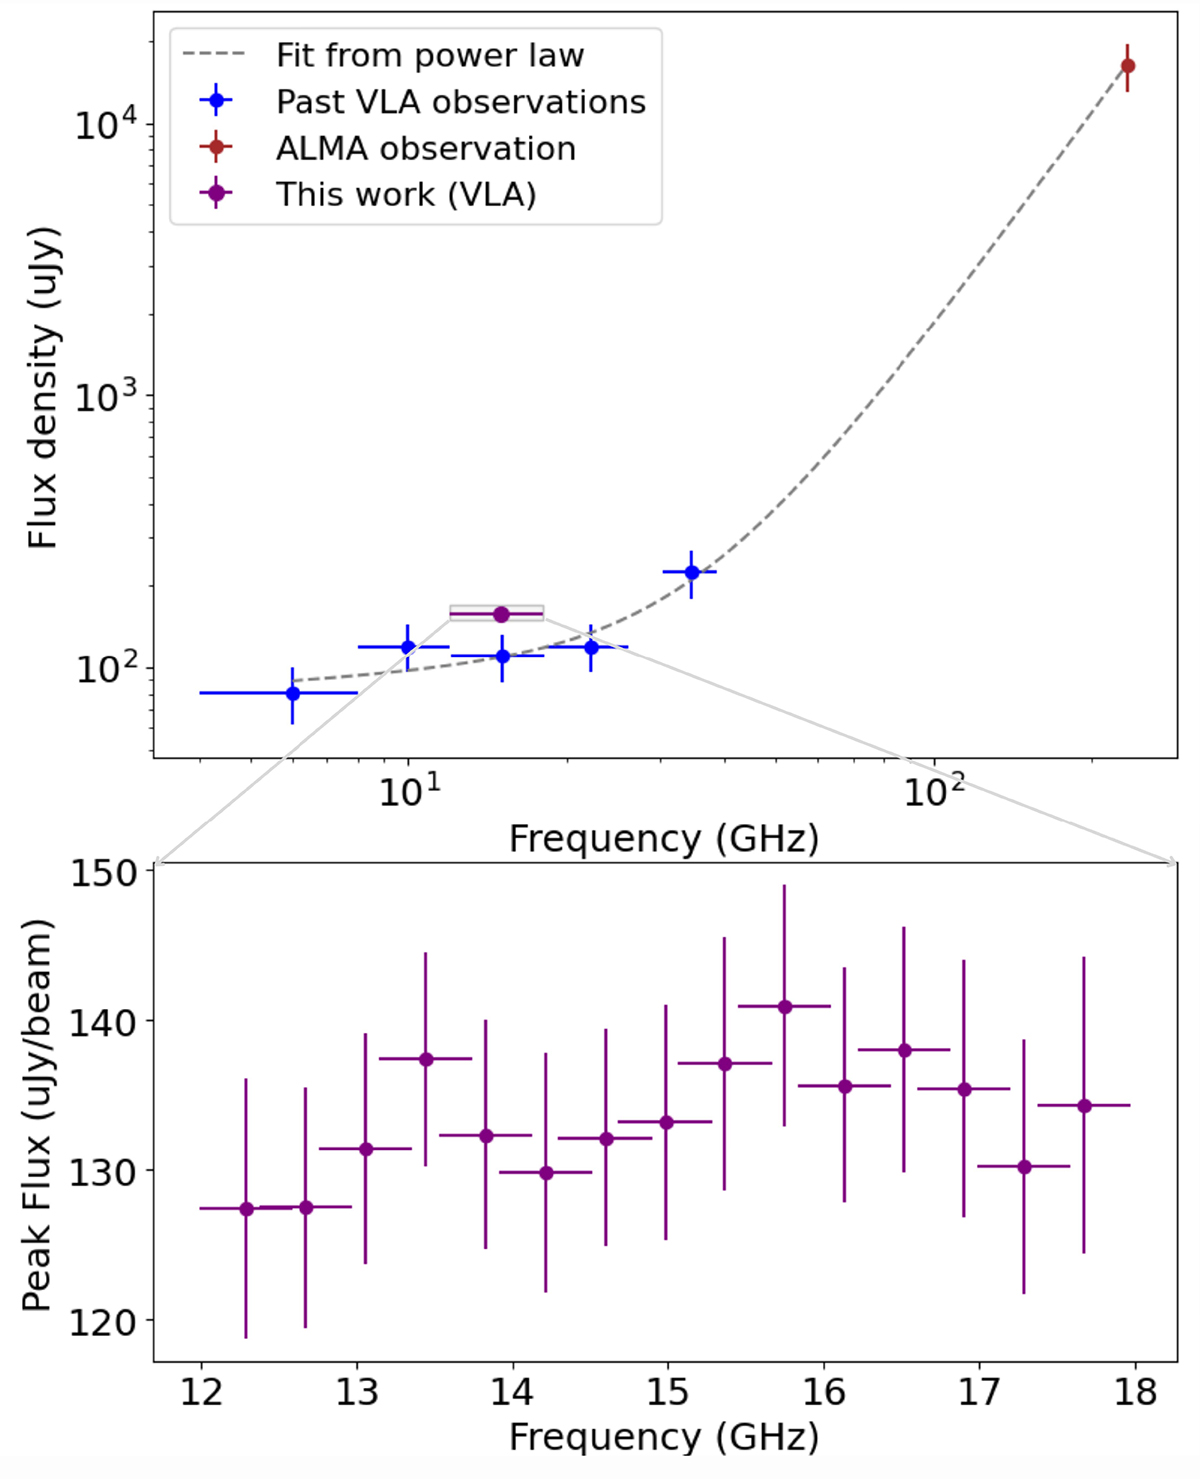
Fig. 4.
Download original image
Broadband spectrum of flux density for the YSO in Stokes I (top), considering all available VLA (4–35 GHz) and ALMA (230 GHz) data (Dzib et al. 2016; Alves et al. 2020; Zurlo et al. 2021). The horizontal bars represent the bandwidth for each observed band. Spectral distribution of mean flux in Stokes I for the current VLA observations (bottom) averaged over all days and over three spectral windows, i.e., 384 MHz. The vertical error bars correspond to the 1σ, while the width of the horizontal bars is equivalent to the bandwidth of 384 MHz over which each data point has been averaged.
Current usage metrics show cumulative count of Article Views (full-text article views including HTML views, PDF and ePub downloads, according to the available data) and Abstracts Views on Vision4Press platform.
Data correspond to usage on the plateform after 2015. The current usage metrics is available 48-96 hours after online publication and is updated daily on week days.
Initial download of the metrics may take a while.